

In my last piece I covered the 9 U.S. cities whose home prices face downward pressure in the AI era. The core logic was that AI is pulling high-income white-collar jobs out of a handful of tech hubs. This article answers the symmetric question: where do those wages go? My conclusion is that AI will not bleed every American city at once. It will redistribute wages toward four industries—healthcare and aging, advanced manufacturing, the energy equipment behind data centers, and government, defense and aerospace. What these four share is that their jobs either cannot be replaced by AI (because a human body must be physically present) or are the physical infrastructure that AI itself cannot do without.
Before looking at any city list, one rule must be established: capital expenditure is not housing demand, GDP is not housing demand; only the wages that ultimately land in local household bank accounts can become local rents and home prices. That rule dictates the method of this article. For each industry I ask four things: how many jobs does it create, can those jobs be replaced by AI, outsourced or done remotely, what is the average wage, and what share of that wage actually stays in the local economy.
 Capex and GDP are balloons overhead; only the wage that lands on the kitchen table is a solid brick
The roadmap is as follows. Section one lays out the judgment framework. Sections two through five break down the mechanism, data and price-transmission path for each of the four industries and list the cities on each track. Section six consolidates the 24 cities into one table and deals with the "conflict cities" that appear on both the losing and winning lists. Section seven responds to the most likely objections. Section eight compresses the method into a checklist readers can apply on their own.
A Framework: Capex Is Not Demand, Wages Are
The demand side of real estate is actually very simple: a city's housing demand equals the number of local households multiplied by their disposable income. Announced investment totals, cranes on a job site, "hundred-billion-dollar projects" in the headlines—these are only the possibility of demand, not demand itself. Capex must first become permanent jobs, jobs must become wages, wages must enter local household accounts, and only then does a portion become rent and mortgage payments. Every link in that chain leaks, and most investors look only at the first link.
The most telling evidence comes from Virginia's legislative audit agency, JLARC. Its study of data centers delivers an almost brutal contrast: a data center employs about 1,500 workers during construction, but once operational it retains only about 50 permanent employees (JLARC, Report 598). In other words, an "AI infrastructure project" that the media hypes endlessly may leave behind less permanent wage flow than a single department of a mid-sized hospital. Compare that with Micron's project in Syracuse, New York: $100 billion in investment, roughly 9,000 direct jobs with average salaries above $100,000, plus an estimated 50,000 supply-chain jobs (Construction Dive; Construction Owners, 2025-2026). Both carry "hundred-billion" headlines; one leaves 50 people, the other leaves 9,000 high-earning households. Their meaning for home prices is entirely different.
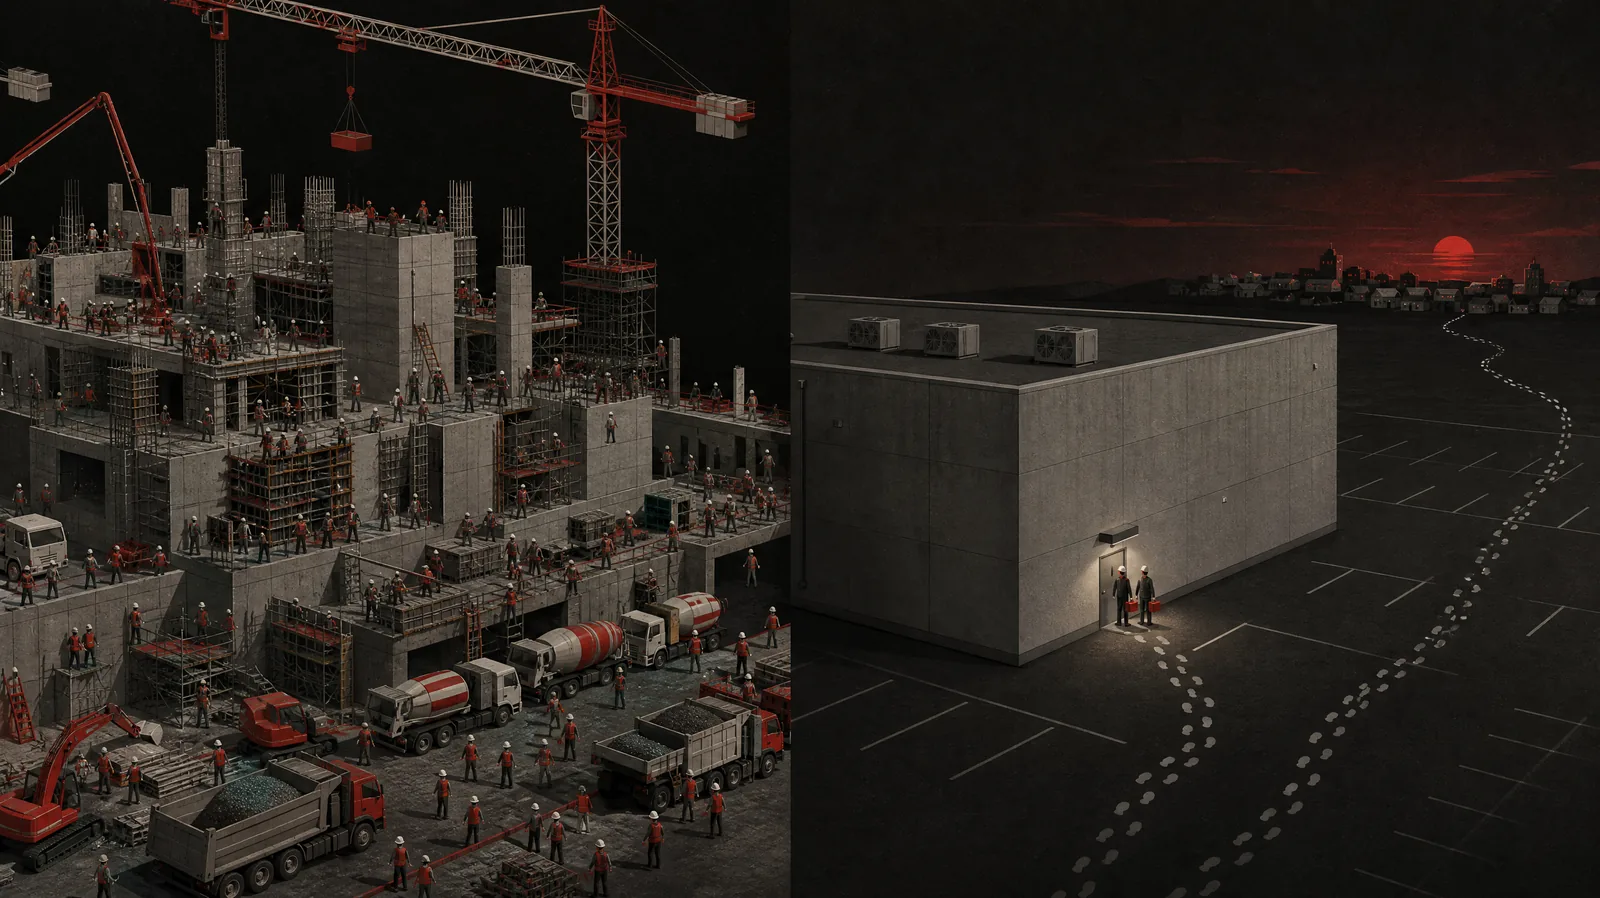 A data center employs 1,500 to build and 50 to run; the bustle is temporary, the lasting wage stream thin
To judge whether a city benefits in the AI era, do not look at how much money it received; look at how many people it keeps, how much those people earn each year, and what share of those wages AI can take away.
So my habit when reading the news is this: when I see "City X lands a $50 billion investment," I don't get excited. I translate it into three numbers—permanent headcount, average wage, probability of AI replacement—and then weigh those three against the local price base and supply elasticity. The next four sections apply that ruler to each industry.
Healthcare and Aging: The Wealthiest Generation Is Getting Old Together
The United States is entering the largest wave of aging in its history. According to the U.S. Census Bureau, by 2030, every Baby Boomer will be 65 or older. More importantly, the timeline is moving up. The Census Bureau's 2017 projections had the 65+ population reaching 77 million and surpassing the under-18 population in 2034; the 2023 projections pull that crossover forward to 2029—about 69.9 million seniors versus 69.3 million children (U.S. Census Bureau, 2023 National Population Projections). Aging is not future tense but present tense: Census Bureau data from 2025 show that in 11 states and nearly half of all U.S. counties, older adults already outnumber children.
 Boomer aging is present tense, not future; this silver wave is redrawing the demand map of cities
What makes this wave unusual is not how many seniors there are, but how wealthy they are. The Federal Reserve's Distributional Financial Accounts (DFA) for the second quarter of 2026 show that Baby Boomers hold about $97.4 trillion in net wealth, 52.5% of all U.S. household wealth—one generation owns more than half—which works out to roughly $1.5 million per person (Federal Reserve DFA, 2026 Q2; Federal Reserve Bank of St. Louis, 2025). Wealthy seniors are the backbone of healthcare spending: according to CMS, per-capita health spending for those 65 and over is about $22,400 a year, 2.4 times that of working-age adults and 5 times that of children; this group is only 17% of the population but accounts for 37% of healthcare spending (CMS, 2020). Concentrated wealth, an aging population and high spending multiples combine into the most certain demand curve of the next decade.
That demand curve translates directly into employment. The Bureau of Labor Statistics' 2025-2035 projections, released in September 2026, show healthcare and social assistance employment growing from 23.29 million to 25.49 million, a net gain of about 2.2 million jobs, or 9.5%, versus a national average of just 3.5%—about 2.7 times the average (BLS, Employment Projections 2025-2035). Wages in the sector are not low either: there are 3.465 million registered nurses nationwide with a median wage of $97,550 (BLS Occupational Outlook Handbook, 2025). A dual-nurse household earns roughly $195,000 a year, enough to support the median home price in the vast majority of U.S. cities outside the Bay Area and Seattle. And this year BLS published AI-exposure categories by occupation for the first time; nursing and similar roles that require physical presence and touching patients are precisely the kind AI finds hardest to replace and that cannot be outsourced or done remotely. In our framework, they pass all four filters at once: not replaceable, not outsourceable, not remote, and wages stay local.
There is an even larger variable: human lifespan itself. Futurist Ray Kurzweil coined the idea of "longevity escape velocity"—the point at which life science adds more than one year of remaining life for every year that passes, so medical progress outruns aging. He projects humanity may approach that threshold around 2029 to 2035 (Kurzweil, Bessemer Venture Partners interview). Whether that prediction comes true does not matter; real estate investing does not need to wait for immortality. As long as the wealthiest generation of seniors lives longer and spends more than the one before it, healthcare wage flows will run stronger than the BLS baseline. I laid out the cash-flow logic of senior-housing assets in The Two Biggest Opportunities of 2026: Senior Housing Cash Flow and Modular Development; this is its macro foundation.
 The wealthiest generation living longer and spending more makes the healthcare wage stream stronger and longer than baseline
| City | Core logic | Key data (source/year) | My assessment |
|---|---|---|---|
| Phoenix | Retirement destination + healthcare cluster; also the semiconductor capital | Southern metros have the fastest 65+ growth (Census Bureau, Vintage 2025 estimates, 2026) | Double beneficiary, but highly elastic supply—watch rents more than prices |
| Las Vegas | Retiree inflows + healthcare expansion | Same | Healthcare jobs provide a floor; watch tourism's AI sensitivity |
| Tucson | Arizona's second retirement destination, low price base | Same | Strong purchasing power of healthcare wages relative to prices |
| San Antonio | Healthcare + military medicine | Same | Overlaps with defense; a conflict city (see Section 6) |
| Sarasota County (Florida Gulf Coast) | Concentration of affluent retirees | Boomers' net wealth ~$1.5 million per person (Federal Reserve DFA, 2026 Q2) | Wealth-transfer demand, constrained by climate and insurance costs |
| Charlotte | Finance + healthcare, Southern growth core | Fastest 65+ growth in Southern metros (Census Bureau, 2026) | Healthcare supports mid-priced housing; finance jobs need separate AI-sensitivity review |
What these six cities share is that the Census Bureau's Vintage 2025 population estimates, released in 2026, show the fastest 65+ growth in Southern metros, and these are the places where both wealthy retirees and healthcare employment are flowing in. Transmission to prices runs along two paths: retirees arriving with their wealth and buying directly, and the nurses, technicians and aides who serve them earning local wages, renting and buying. The first supports upper and upper-mid housing; the second supports mid-priced housing and the rental market. My judgment is that the second path is steadier, more durable, and better suited as a cash-flow base for investors.
Advanced Manufacturing: Semiconductors and AI Hardware Bring High Wages to Low-Price Cities
I believe American manufacturing is splitting into two entirely different worlds. Traditional autos, commodity components and highly repetitive assembly-line production face continuous replacement by AI plus robotics—producing more with fewer people. Cities built on those industries will see their total wage base shrink. But another kind of manufacturing is entering a long boom: the advanced manufacturing the AI era cannot function without—semiconductors and advanced packaging, AI servers and networking equipment. The mechanism is simple. AI's demand for compute is physical; chips must be made in fabs and servers must be built on assembly lines, and for supply-chain-security reasons these steps are being moved back to U.S. soil at scale.
 Manufacturing is splitting in two: assembly lines hollowed out by robots, and fabs that must be run by people
The magnitude of the numbers speaks for itself. TSMC's Arizona investment was announced in March 2025 at $165 billion and six fabs (TSMC Form 6-K filing with the SEC, 2025); in July 2026 it added another $100 billion, bringing the total to $265 billion, with plans for 10 fabs, 2 advanced packaging plants and an R&D center (Arizona Commerce Authority, July 2026). Micron's Syracuse, New York project involves $100 billion of investment, about 9,000 direct jobs averaging over $100,000 a year, and an estimated 50,000 related jobs (Construction Dive; Construction Owners). Intel's project near Columbus, Ohio involves $28 billion, 3,000 permanent jobs and 7,000 construction jobs—but honesty requires adding that the project has been delayed to 2030-2031 (Construction Dive; Intel Newsroom). The three projects together total roughly $393 billion. In terms of the existing employment base, FRED/BLS data for September 2026 show about 373,000 workers in semiconductors and electronic components, 99,400 in computers and peripheral equipment, and 82,700 in communications equipment. This is not a large industry by headcount, which is exactly why every few thousand new jobs have an outsized marginal effect.
Advanced manufacturing's push on home prices depends on the ratio of new high-wage jobs to the local price base—9,000 jobs at $100,000 a year mean something completely different in Syracuse than in the Bay Area.
That is why, over the next decade, I will pay particular attention to Phoenix, Columbus, Syracuse, Boise, Albuquerque and Portland—Syracuse and Columbus above all. Their biggest difference from the Bay Area is that local home prices remain low. If a city suddenly adds several thousand advanced-manufacturing jobs paying over $100,000, layered with tens of thousands of supply-chain and service jobs, while its home prices are a fraction of the Bay Area's, those new wages push on real estate very directly. This matches what I argued in AI Is Laying Off White-Collar Workers, but Blue-Collar Workers Will Get Richer: the AI-era redistribution of wealth flows from "cities that write code" to "cities that make chips."
 The same 9,000 high-wage jobs lift a low-priced city many times harder than they lift the Bay Area
| City | Core project/industry | Key figures (source/year) | My assessment |
|---|---|---|---|
| Phoenix | TSMC fab cluster | $265 billion, 10 fabs + 2 packaging plants + R&D center (Arizona Commerce Authority, July 2026) | America's semiconductor capital; combined with aging, strongest demand—but supply can also expand the most |
| Columbus | Intel Ohio One | $28 billion, 3,000 permanent + 7,000 construction jobs, delayed to 2030-2031 (Construction Dive) | Low price base, but time purchases to the production schedule |
| Syracuse | Micron megafab | $100 billion, 9,000 jobs averaging $100K+, ~50,000 related jobs (Construction Owners) | My top "wage-to-price ratio" city this round |
| Boise | Memory-chip headquarters and manufacturing | — | Existing industrial base; verify marginal new jobs item by item |
| Albuquerque | Semiconductors and national labs | — | Wage base advantageous relative to prices |
| Portland | "Silicon Forest" semiconductor cluster | — | Mature industry, constrained supply; more about holding value than a breakout |
One risk beyond the table deserves emphasis: Intel's delay is a reminder that the gap between a fab's "announcement" and its "production" is often more than five years, and only post-production operating jobs are a continuous wage flow. The right cadence for investors is not to buy on the day of the press release, but to track project milestones and step in when the hiring window actually opens and rental demand begins to appear.
Data Centers and Energy: The Real Winners Are the Power-Equipment Factories
The most visible physical embodiment of AI is the data center, so many people's first instinct is to buy homes in the cities with the most data centers. That instinct mistakes capex for demand. Data centers are extremely capital-intensive, but they are also extremely capital-intensive per worker—they are buildings that replace labor with electricity and racks. The JLARC figures cited above say it all: 1,500 workers during construction, 50 afterward. A data center's real effect on a local housing market is roughly a two-year construction rental spike, and then nothing.
But data centers' demand for electricity is real and enormous. The International Energy Agency's Energy and AI report projects that global data-center electricity consumption will double to about 945 terawatt-hours by 2030, and that nearly half of new U.S. electricity demand will come from data centers (IEA, 2025). Where does that power come from? Gas turbines, transformers, switchgear and transmission equipment—things made by people in factories, not generated by algorithms in server rooms. So when I see a $50 billion data-center project, I don't immediately ask where the servers are. I follow the chain three layers back: where is the data center → where does its power equipment come from → whom does the equipment factory pay.
 Don't stop at the server room: where is the data center, where does the power come from, who builds the gear—wages live at layer three
At the third layer, the answer lands in places nobody today thinks of as "AI cities." GE Vernova announced a first round of nearly $600 million in U.S. factory investment and more than 1,500 jobs in 2025, and its year-to-date total has now reached 1,750 jobs and $680 million (GE Vernova, 2025-2026). That includes a $160 million, 650-job gas-turbine plant in Greenville, South Carolina, and a grid-equipment expansion in Charleroi, Pennsylvania adding 250 jobs. Hitachi Energy's transformer plant in South Boston, Virginia represents $457 million and 825 jobs (Utility Dive), and in September 2026 the company announced a $528 million, 700-plus-job transformer factory in Gallman, Mississippi (Hitachi Energy, September 2026). These towns have no OpenAI, no Google and no hundreds of thousands of programmers, but they are building the thing AI needs most—power equipment.
| City | Company/product | Key figures (source/year) | My assessment |
|---|---|---|---|
| Greenville, SC | GE Vernova gas turbines | $160 million, 650 jobs (GE Vernova, 2025) | Manufacturing and engineering jobs are incremental demand for mid-priced housing |
| South Boston, VA | Hitachi Energy transformers | $457 million, 825 jobs (Utility Dive) | Small population base; a few hundred jobs are enough to shift supply and demand |
| Charleroi, PA | GE Vernova grid equipment | 250-job expansion (GE Vernova) | Old industrial town reindustrializing; extremely low price base |
| Gallman, MS | Hitachi Energy transformers | $528 million, 700+ jobs (Hitachi Energy, September 2026) | Newly announced; at the earliest stage of the transmission chain |
Data centers do not create housing demand, but the power shortage they cause creates manufacturing housing demand; what truly deserves attention in the AI era are the cities regaining hundreds, thousands or even tens of thousands of permanent manufacturing, engineering and energy jobs because AI is short of electricity.
 Data centers don't create housing demand; their hunger for power creates it in small manufacturing towns
In small cities the transmission to prices is especially direct: the housing stock is small to begin with, so a few hundred stable manufacturing and engineering jobs can push vacancy to very low levels. As someone who develops modular housing, I have a second reason to be interested in these towns—they are precisely where supply cannot keep up and where traditional construction capacity is thinnest, so new housing has to be "manufactured" into existence. Of course, these cities are small, illiquid and dependent on a single employer, so investments must be priced on cash flow rather than on appreciation expectations.
Government, Defense and Aerospace: The More AI Advances, the Bigger Government Gets
I group these industries together because I hold a view that runs counter to many people's intuition: the more AI advances, the larger government's role in the economy becomes. The mechanism has three layers. First, AI replaces private-sector white-collar jobs, while public-sector hiring is not driven by profit margins and contracts far more slowly than corporations. Second, AI itself is a national-security issue, and defense and intelligence spending around compute, chips, data and space will only rise. Third, regulation, compliance and procurement functions expand precisely as technology spreads. Where the three lines converge, government and defense wages become relatively more stable, less replaceable and harder to outsource in the AI era.
Wage levels in this sector are far higher than most people imagine. According to the Aerospace Industries Association's 2026 industry data, the U.S. aerospace and defense industry supports 2.1 million jobs, $266 billion in total labor compensation and an average wage above $127,000, with industry sales reaching $1 trillion (AIA, 2026). An average wage of $127,000 approaches tech-industry levels, yet its AI-replacement, outsourcing and remote-work risks are all far lower than those of software jobs—building aircraft, maintaining missiles and developing simulation-training systems must be done in specific physical locations under specific security clearances. By our framework, this is the best combination of "high wage" and "stays local."
 Security-cleared jobs are the wages algorithms can't take; they give home prices a floor set by the federal budget
Beyond the well-known defense hubs of Washington, D.C., Northern Virginia, San Diego and San Antonio, I am paying special attention to several cities most people would never think of. Here one fact must be corrected: U.S. Space Command headquarters is confirmed to be moving from Colorado Springs to Huntsville, Alabama, announced in September 2025, with the first office building opening in April 2026 and about 1,400 jobs relocating within five years (City of Huntsville; WAFF, September 2026). Colorado Springs still retains the Space Force, NORAD and other major institutions, but Space Command now belongs in Huntsville's plus column. Lockheed Martin's Marietta, Georgia plant employs 5,600 people, has added 1,200 jobs since 2019 and contributes $4.5 billion to Georgia's economy (Office of the Governor of Georgia, June 2026). Orlando, Florida is the global center of the simulation and training industry, with more than $6 billion in annual simulation-training contracts supporting nearly 30,000 high-tech jobs (Orlando Economic Partnership).
| City | Pillar | Key figures (source/year) | My assessment |
|---|---|---|---|
| Washington, D.C. / Northern Virginia | Federal government, defense contractors | AIA: industry average wage above $127,000 (2026) | Most irreplaceable wages, but discount the data-center component per JLARC logic |
| San Diego | Navy, defense R&D, healthcare | — | Conflict city, see Section 6 |
| San Antonio | Military medicine, cybersecurity | — | Conflict city; benefits from both healthcare and defense |
| Huntsville | Space Command, Redstone Arsenal | ~1,400 jobs relocating within 5 years (City of Huntsville, 2026) | The most certain increment this round, with a low price base |
| Colorado Springs | Space Force, NORAD | Loses Space Command headquarters | Fundamentals intact, but expectations need to be lowered |
| Marietta | Lockheed Martin | 5,600 employees, +1,200 jobs since 2019 (State of Georgia, 2026) | A stable high-wage anchor inside the Atlanta metro |
| Orlando | Simulation and training | $6 billion+ in annual contracts, nearly 30,000 high-tech jobs (Orlando Economic Partnership) | High-tech jobs hedge tourism's AI sensitivity |
In the AI era, wages that come with a security clearance are the hardest for an algorithm to take; in cities dense with defense and government jobs, the floor under home prices is set by the federal budget, not by tech companies' quarterly earnings.
One distinction matters for transmission: D.C. and Northern Virginia already have a high demand base, so the marginal effect of new jobs is relatively mild and shows up mostly as resilience; in cities like Huntsville and Marietta, more than a thousand high-wage jobs arriving against a low price base is a genuine increment.
 The same thousand high-wage jobs merely cushion DC, but are pure increment in Huntsville
The 24 Cities Consolidated, and How to Handle Conflict Cities
Putting the four tracks together, this analysis names 24 entries: 14 mainstream cities most people recognize, and 10 small cities that are rarely thought of as "AI cities." Phoenix and San Antonio each appear on two tracks, which is itself a signal—a city with two irreplaceable industries is far more stable than one with only a single pillar.
| Track | Mainstream cities | Overlooked small cities | Core demand |
|---|---|---|---|
| Healthcare and aging | Phoenix, Las Vegas, Tucson, San Antonio, Sarasota County, Charlotte | — | Boomer wealth transfer + healthcare wages (BLS projects 9.5% sector growth) |
| Advanced manufacturing | Phoenix, Columbus, Syracuse, Boise, Albuquerque, Portland | — | Semiconductor and AI hardware jobs (TSMC $265B, Micron $100B, Intel $28B) |
| Data centers and energy | — | Greenville, South Boston, Charleroi, Gallman | Power-equipment manufacturing jobs (GE Vernova, Hitachi Energy) |
| Government, defense, aerospace | Washington, D.C., Northern Virginia, San Diego, San Antonio | Huntsville, Colorado Springs, Marietta, Orlando | Defense and government wages (AIA average above $127,000) |
But here is the problem: several of the 9 cities I said would be hit hardest by AI also appear on today's beneficiary list. The clearest case is San Diego—dragged down by education, pharmaceuticals and tourism, yet lifted by healthcare and government defense. San Antonio and Phoenix have a similar double-sidedness. So do these cities' prices go up or down? The honest answer is that you cannot decide by counting industries; you have to break each industry down to three variables—headcount, AI sensitivity and local supply elasticity.
 A city on both the losing and winning lists isn't a contradiction; it's a reminder to count heads and wages by industry
That is exactly what I will be doing over the next two months: publishing ten analyses that systematically dissect home prices in ten major U.S. cities, laying out every core industry, its headcount, its AI sensitivity and its supply elasticity. The next city is Dallas—and Dallas's biggest problem is not AI's impact but supply elasticity. I ran this framework once on Seattle in Quantifying AI's Impact on Seattle Home Prices; now it is being extended nationwide.
A city appearing on both the losing and winning lists is not a contradiction; it is a reminder that you have to do the math—how many people on each side, how much they earn, and how much AI can take away.
Counterarguments and Responses
Objection one: More than half of these 24 cities are in the Sun Belt, where supply elasticity is extremely high. When wages rise, houses get built without limit, so what rises is the number of homes, not their prices.
This is the strongest objection, and I partly agree with it. In cities like Phoenix, Las Vegas, San Antonio and Charlotte, land is abundant and permitting is lenient, so new demand is easily absorbed by new supply—which is exactly why I say Dallas's biggest problem is supply elasticity rather than AI. But this objection does not negate the article's conclusion; it changes the way you invest. In high-elasticity markets, the payoff from wage inflows shows up more in rents and occupancy than in explosive price appreciation. Investors should price on cash flow rather than appreciation, and favor new construction and build-to-rent over chasing existing homes. Conversely, in supply-constrained cities like Portland, San Diego and D.C., the same wage inflow converts more fully into price. The list answers "where do wages flow," not "where do prices rise fastest"—those are two separate questions.
 In high-elasticity markets, wage inflows become more houses and rent, not a price spike
Objection two: You criticize data centers for leaving only 50 jobs, but the $393 billion in fab investment is also overwhelmingly construction-phase spending, and Intel has already slipped to 2030-2031. Why believe semiconductor cities will be any different?
This challenge is precisely why I insist on counting only permanent jobs. The figures in this article are operating jobs, not capex: Micron's 9,000, Intel's 3,000 (I deliberately listed the 7,000 construction jobs separately). The essential difference between a fab and a data center is capital per worker—a completed fab needs thousands of engineers and technicians to run continuously, while a data center needs a few dozen people. As for delays, they are a real risk, which is why my advice is to track milestones and enter on the production timeline, not on announcement day. A delay postpones the wage flow; it does not change its direction. If a project were canceled, that would be a different story—which is also why you spread across multiple cities rather than bet on one project.
Objection three: A nurse's median wage of $97,550 is nowhere near tech compensation. Healthcare jobs cannot support home prices.
A single nurse indeed cannot support Bay Area or Seattle prices, but this article is about mid-priced cities like Tucson, San Antonio and Charlotte. A dual-nurse household earning roughly $195,000 is upper-middle income in those markets. More importantly, consider the structure of the demand: the significance of healthcare jobs is not that they create demand for luxury homes, but that they provide a floor for mid-priced housing and rentals that is almost immune to AI and to the business cycle—BLS projects a net gain of 2.2 million jobs in the sector over ten years, 2.7 times the national average growth rate. For investors, "steady but unspectacular" demand is exactly what a cash-flow asset wants.
 Healthcare wages won't float mansions, but they lay an AI-proof foundation under mid-priced homes and rentals
Method Summary: Six Questions to Ask When You See a Big Investment Headline
The real point of this piece is not the list of 24 cities but a method you can apply over and over. The next time a city announces a $50 billion investment, don't get excited; when a data center arrives, don't rush to buy. Run the news through these six questions:
- How many permanent jobs does this industry actually create? Count construction-phase and operating jobs separately, and use only the latter (JLARC's 1,500 versus 50 and Intel's 7,000 versus 3,000 were split exactly this way).
- Can these jobs be replaced by AI? Jobs that require physical presence, handling physical objects or holding a security clearance have the lowest replacement probability; BLS has now published AI-exposure categories by occupation as a reference.
- Can they be outsourced? Can they be done remotely? Remote-capable jobs can pay wages anywhere; jobs that cannot be done remotely keep wages local.
- What is the average wage? Use BLS medians or company-disclosed average compensation, not the words "high-paying" in a press release.
- How much of the wage actually stays local? The share of local hires, whether families relocate, and the purchasing power of the wage relative to local prices.
- What is local supply elasticity? This decides whether the wage inflow ends up as higher prices or as new homes—watch rents in elastic markets, prices in constrained ones.
Put the six answers together, layer on the list of losing industries from my previous piece, and you can reach a judgment on a city's "net wage flow." That is the process I will use for the next ten city breakdowns: ten cities, ten industrial structures, ten completely different answers. Two months from now, I hope we will have drawn together a map of American real estate that truly belongs to the AI era.
 Lists expire, the method doesn't: run six questions city by city and draw your own AI-era real estate map