

© 2026 Wei Li · Homepedia. All rights reserved. The text, data and charts in this report are protected by copyright and may not be copied, republished, excerpted or used commercially without written permission.
Abstract
Dallas–Fort Worth (DFW) has been one of the strongest large labor markets in the United States. Employment grew 10.3% between 2019 and 2024—more than twice the national rate of 4.6%—while Boston shrank 0.5% and San Diego grew 3.2%. Corporate headquarters keep arriving, banks are building campuses for thousands of employees, and data-center power requests have pushed the Texas grid’s large-load queue to 438 GW. Conventional wisdom says a metro like this should post the biggest price gains in the country.
It did the opposite. From December 2019 to August 2026, DFW’s typical home value rose just 37.5%, trailing the U.S. (47.9%), Boston (47.4%) and San Diego (54.4%). DFW is the only one of the three metros still 8.6% below its 2022 peak. Even over the same window as the job data (through December 2024), DFW’s gain (45.7%) merely matched Boston (44.0%) and the nation (46.9%)—job growth several times larger produced no larger price gain. Our central thesis, and the one Wei Li stated on the SeaHomepedia Housing Map, is: AI investment and corporate relocation are genuinely supporting DFW jobs, but building is so easy here that new demand is absorbed by new supply. Prices therefore diverge by location and product rather than rising across the board.
We test that thesis with 19 charts built directly from public data, drawing on three layers of evidence. Supply: DFW permitted 423,000 housing units in 2020–2025, 5.5 times Boston and 6.7 times San Diego; by Saiz’s (2010) estimates in the Quarterly Journal of Economics, Dallas’s housing supply elasticity is more than three times San Diego’s. A regression across 73 U.S. metros shows that, holding job growth constant, each percentage point of job growth raises prices by about 2.9 points in a metro as supply-constrained as San Diego and by roughly zero in Dallas. Had DFW been as hard to build in as San Diego, its 2019–2024 job growth would have produced about 18 percentage points more price growth. Prices: active inventory is 35% above its pre-pandemic level for the same months, while Boston and San Diego remain below theirs. Divergence: over the past three years, the cheapest fifth of DFW ZIP codes fell 6.9% while the most expensive fifth fell only 0.3%; condos sit 13.8% below their peak; apartment rents are up only 18.9% since 2019 versus 39.2% for single-family rentals.
Our base case is “sideways with divergence”: over the next 12–24 months, overall DFW prices are roughly flat, single-family homes in established neighborhoods and top school districts hold up best, and new-construction-heavy exurbs, condos and new apartments remain under pressure. The report closes with concrete strategies for buyers, sellers and investors, and eight leading indicators readers can track each quarter.
Key Findings
- Demand is real. DFW jobs grew 10.3% in five years, more than twice the national pace, as headquarters, bank campuses and data centers keep arriving.
- Supply is stronger. DFW permitted 423,000 homes in 2020–2025—3–4 times Boston per resident. New demand was absorbed, and prices are 8.6% below their 2022 peak.
- The mechanism holds up. Across 73 metros, the easier it is to build, the less job growth turns into price growth. In DFW the pass-through is close to zero.
- Divergence, not a broad rally. The priciest ZIP codes are flat over three years (−0.3%); the cheapest fell 6.9%. Condos and new apartments are weakest; established neighborhoods and top school districts are strongest.
- AI widens the gap. Back-office and entry-level white-collar roles are under pressure, weakening demand at the low end; affluent buyers are comparatively stable.
- Base case: flat overall with internal divergence; mortgage rates back below 6% are the main trigger for a broad recovery.
- For Chinese buyers: Texas SB 17 restricts some foreign purchasers. Citizens and green-card holders are unaffected; visa holders may buy one homestead.
1. Introduction: Research Questions and Central Thesis
The single most important sentence about DFW is this: its home prices are set not by demand alone, but by a race between demand and supply.
In Boston and San Diego, oceans, mountains and strict permitting lock up land, so new demand turns almost entirely into higher prices. In DFW, flat North Texas prairie extends in every direction, permitting is comparatively permissive, and several of the nation’s largest homebuilders are headquartered here (D.R. Horton is based in Arlington). When demand shows up, the bulldozers follow. The same demand shock becomes higher prices in San Diego and more houses in DFW.
That does not make DFW homes bad assets. DFW’s demand fundamentals are among the best in the country. The point is that the metro-wide average price will not keep outperforming just because demand is strong, because every seller hoping to raise the price is competing with a builder offering a 3.99% rate buydown. The real opportunities and risks are found in the divergence: which locations new supply cannot reach, which products have no substitutes, and which areas are being flooded with new homes.
The SeaHomepedia Housing Map scores DFW on five dimensions. This report provides the evidence for each:
| Dimension | Map rating | Evidence in this report (section) | Verdict |
|---|---|---|---|
| AI job risk | Medium | 31.2% of jobs highly exposed—slightly above the U.S. (28.6%), below Boston (32.1%) (§3) | ✓ Supported |
| Infrastructure upside | High | ~1 GW operating, 700 MW under construction, 3 GW planned data-center capacity (§4) | ✓ Supported; limited housing pass-through |
| Marginal affluent buyer | Modest gain | Out-of-state movers earn about what locals do; net domestic migration down ~80% from 2022 (§5) | ✓ Supported |
| Supply elasticity | High | 3–4× Boston’s permits per resident; Saiz elasticity 2.18–2.80 (§6) | ✓ Strongly supported |
| Price pressure | Divergent | Systematic divergence by ZIP, county, price tier and product type (§7) | ✓ Strongly supported |
2. Economic Fundamentals: Industry Structure and High-Income Employment
2.1 Employment Growth
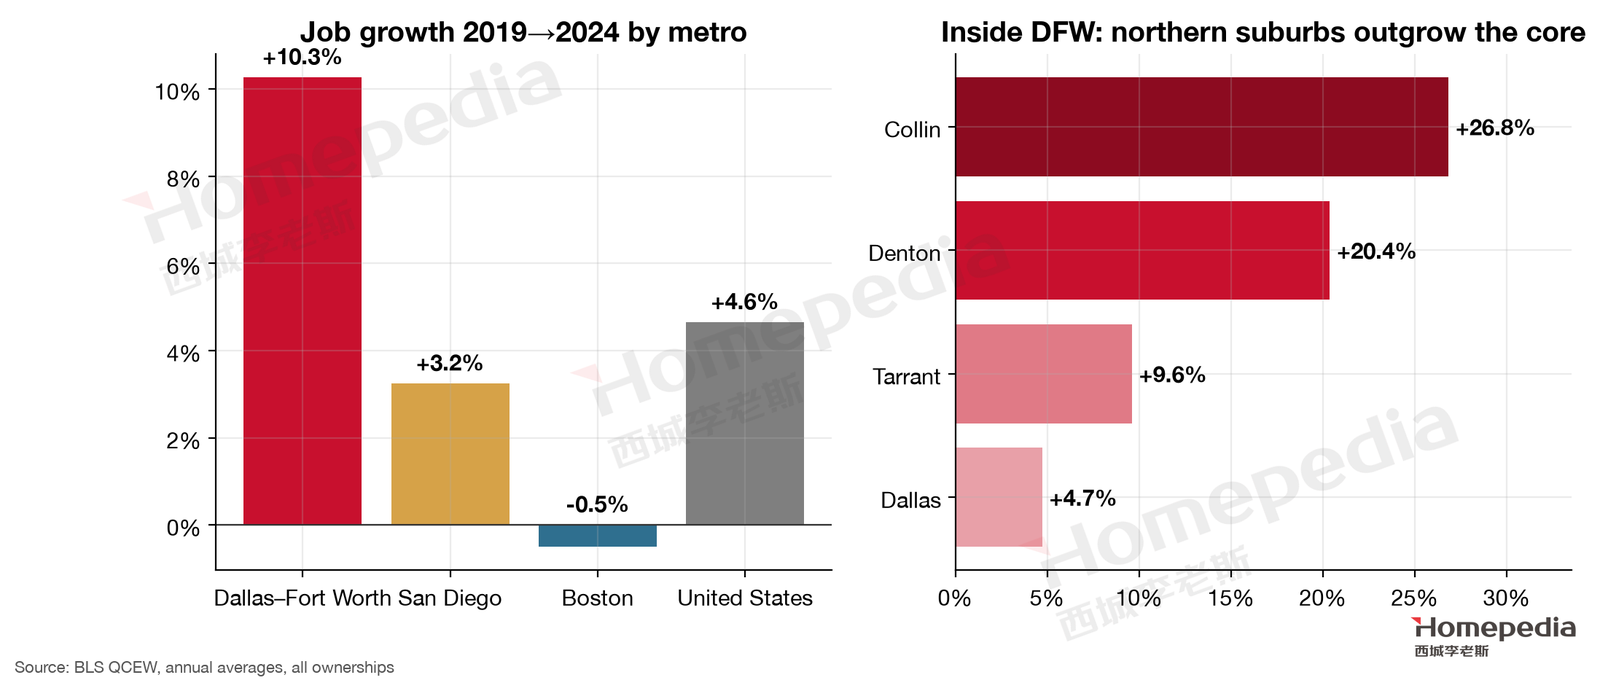
According to the BLS Quarterly Census of Employment and Wages (QCEW)—the most complete count of jobs covered by unemployment insurance—DFW’s average employment rose from 3.63 million in 2019 to 4.00 million in 2024, a 10.3% gain. Over the same period the U.S. grew 4.6%, San Diego 3.2%, and Boston contracted 0.5% [1]. More recent monthly data show DFW nonfarm employment at 4.36 million (seasonally adjusted) in August 2026, 14.1% above December 2019 [2].
Growth has been uneven within the metro. Collin County to the north (Plano, Frisco, McKinney) added 26.8% to its job base in five years and Denton County 20.4%, while Tarrant County (Fort Worth) grew 9.6% and core Dallas County only 4.7% (Figure 1, right). Corporate campuses, new subdivisions and affluent households have moved north together. This matters for prices: Collin County, the fastest-growing job market in DFW, is also among the counties with the deepest price declines from peak (−11.0%, see §7). Strong demand with weak prices is the most direct sign of supply absorbing demand.
2.2 Industry Composition
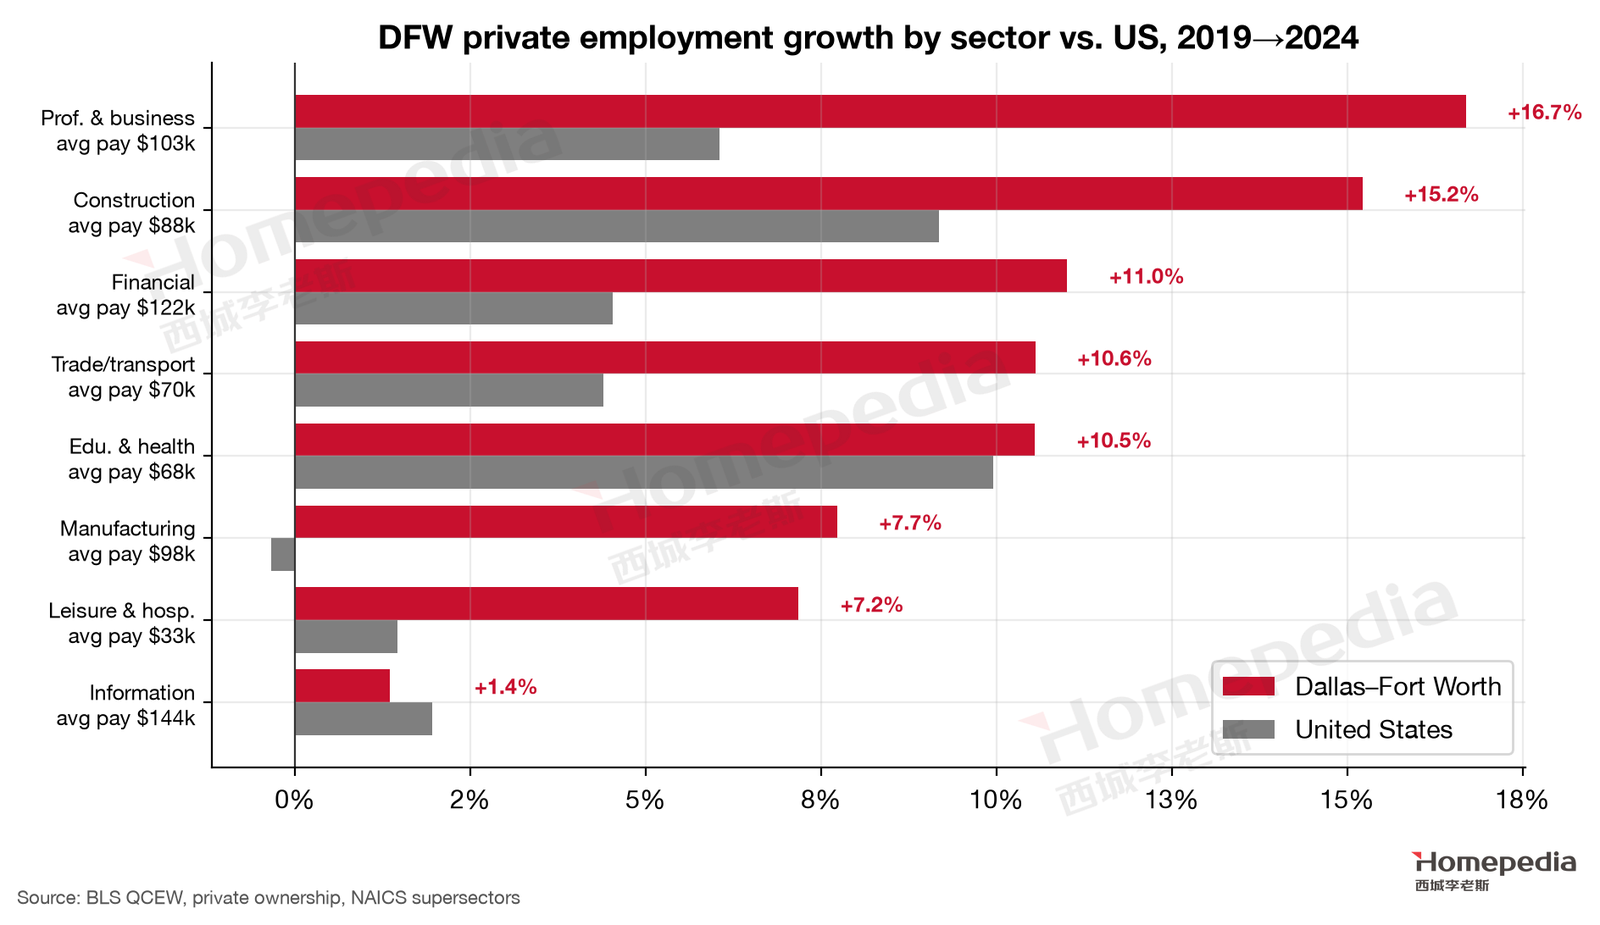
DFW’s growth was not built on low-wage services. From 2019 to 2024 the fastest-growing private sectors were professional and business services (+16.7% vs. +6.0% nationally; average pay $102,848) and construction (+15.2% vs. +9.2%; $87,644). Financial activities grew 11.0% (vs. +4.5%), with average pay of $122,224 [1]. Manufacturing grew 7.7% while national manufacturing employment was flat.
The one soft spot is information—software publishing, telecom and data processing, the traditional “tech” sector—which grew only 1.4% in five years. It pays the most ($143,683) but employs just 78,000 people. In other words, DFW is not a tech city; it is a headquarters city, a finance city and a logistics city. That shapes its AI risk profile: it lacks San Francisco’s concentrated “tech layoffs → disappearing affluent buyers” risk, but it has a large back-office workforce exposed to AI automation (§3).
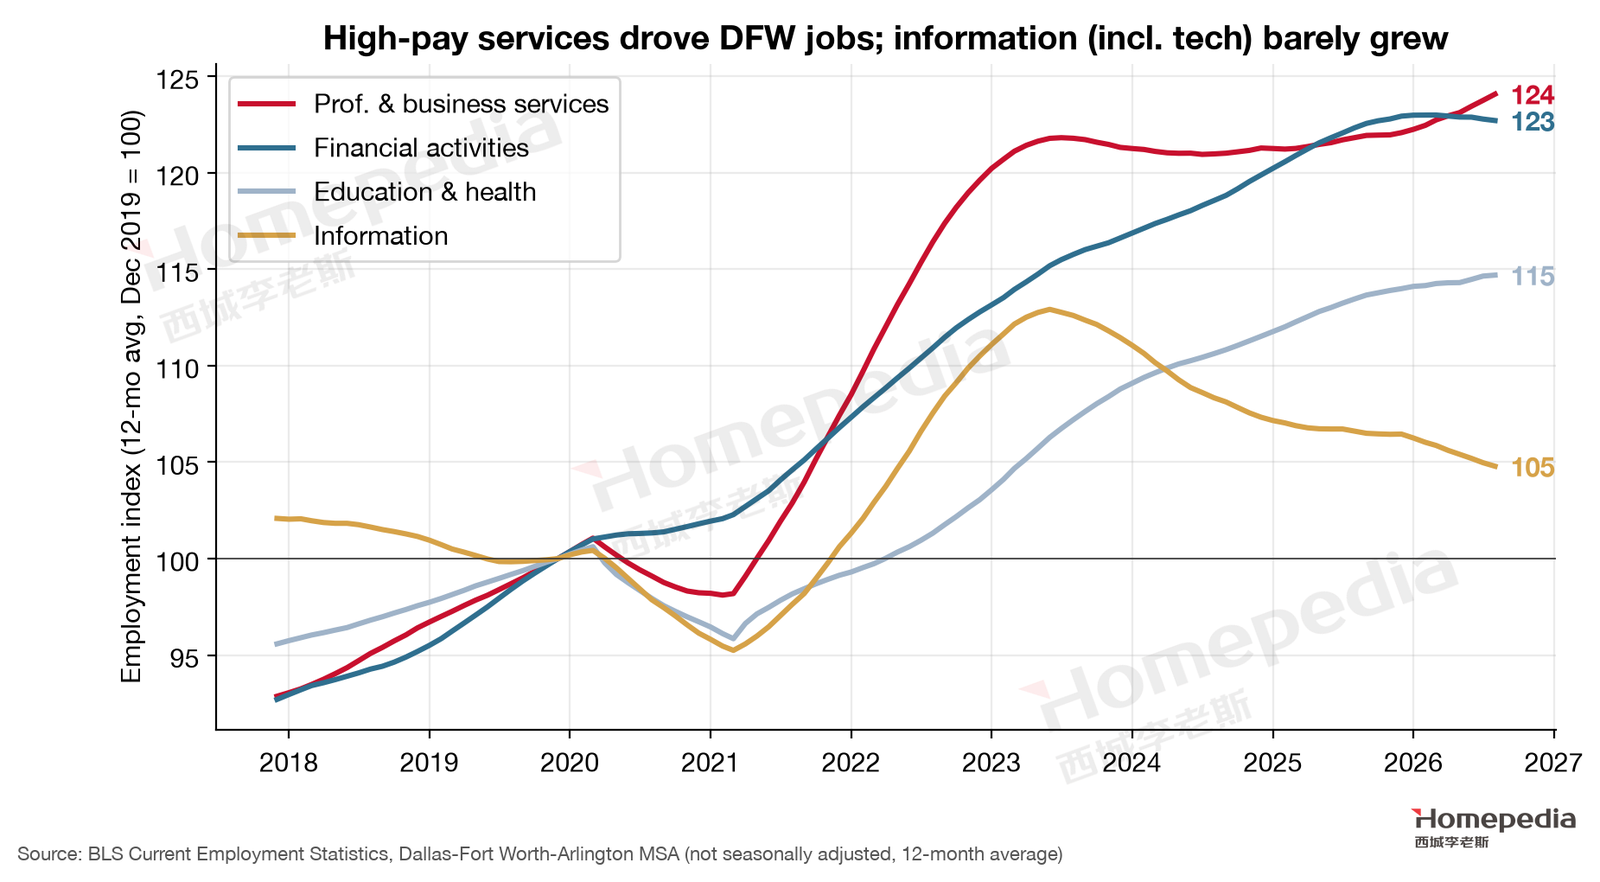
The monthly series (Figure 3) sharpen the picture. As of August 2026, DFW professional and business services employment is 24.4% above late 2019, finance 20.6%, education and health 13.1%, and information only 2.8%—and declining since 2023 [2].
2.3 Corporate Relocation and Financial-Sector Agglomeration
Behind the numbers is a seven-year wave of corporate relocation. CBRE counts roughly 100 headquarters relocations to DFW in 2018–2024, the most of any U.S. metro (Austin was second with 81) [21]; according to CBRE’s latest count as reported by WFAA, DFW again led in 2025 with 11 net interstate or international headquarters moves [21].
Finance stands out because it brings jobs paying hundreds of thousands of dollars:
- Goldman Sachs is building a Dallas campus designed for more than 5,000 employees, expected to open in 2028 [22];
- Wells Fargo has opened a roughly $570 million campus in Irving–Las Colinas for about 4,500 employees [23];
- JPMorganChase employs about 13,000 people at its Plano Legacy West campus [24];
- The Texas Stock Exchange (TXSE), headquartered in Dallas, began live trading in July 2026 and listed its first ETFs in September [25].
This is real, high-quality demand. But keep the report’s central point in mind: high-income jobs are necessary, not sufficient. In DFW, every Goldman Sachs employee who goes house hunting is courted by dozens of new communities.
2.4 High-Income Employment and Upper-Tier Housing Demand
The top of the price distribution is set by high-income households. Per OEWS 2025, occupations with mean pay of $150,000 or more account for about 194,000 jobs in DFW [3]—senior managers (general and operations managers average $139,120, with higher executive roles above $150,000), physicians, lawyers, software architects and finance professionals. Using a common rule that a home should cost no more than 4–5 times annual income, this group supports homes in the $600,000–$750,000 range—precisely the price band of DFW’s most expensive fifth of ZIP codes (median about $608,000, §7).
This explains why DFW’s top tier barely fell during the correction: its buyer pool is stable in size, comparatively insulated from AI, and established neighborhoods at this price point face little direct new-home competition. By contrast, the $300,000–$400,000 buyer pool is much larger but has more fragile incomes and far more new-home options.
QCEW wage data point the same way. Average annual pay across all DFW industries rose from $64,090 in 2019 to $80,680 in 2024, a 25.9% gain, roughly in line with the nation (27.7%) [1]. DFW’s advantage is the number of jobs, not faster pay growth per job. More jobs and more people mean demand for quantity of housing—and quantity is exactly what DFW is best at supplying.
3. Artificial Intelligence and the Labor Market
3.1 Occupational AI Exposure
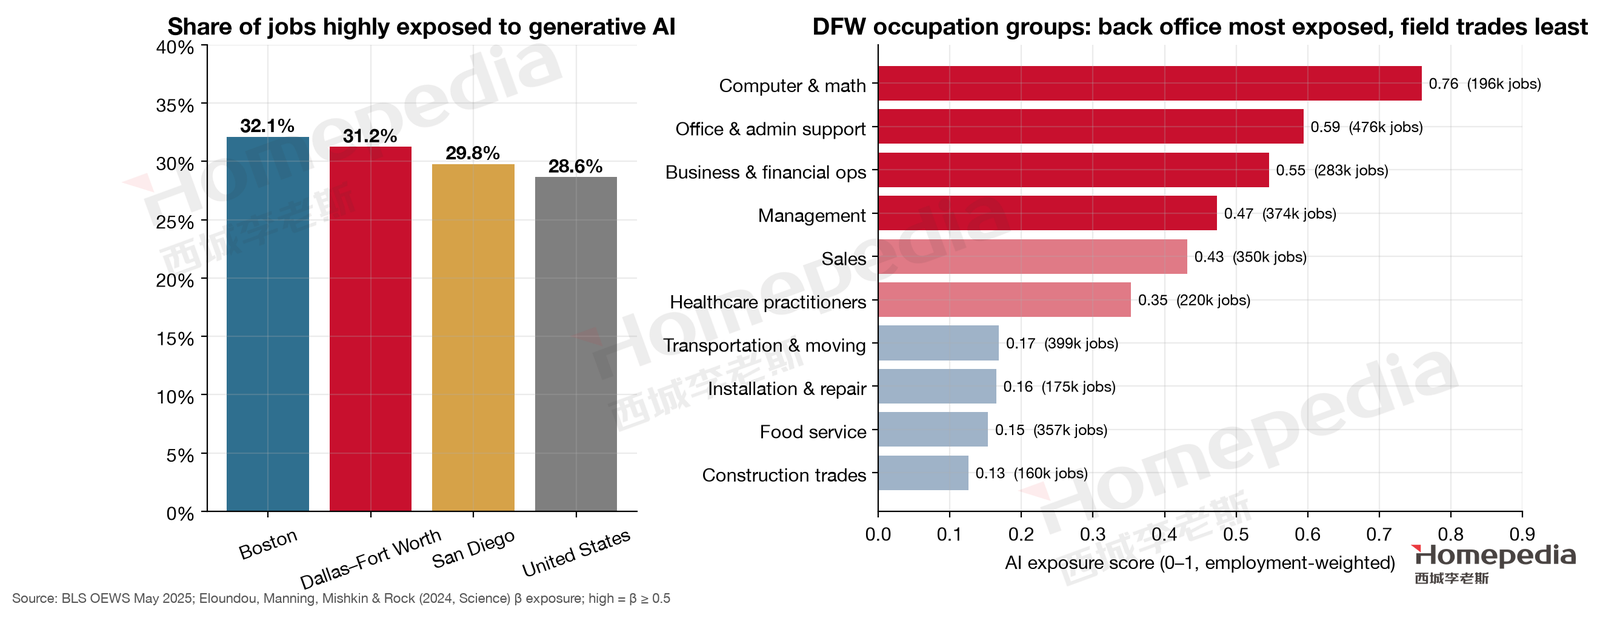
We measure DFW’s AI exposure with two public sources: the BLS Occupational Employment and Wage Statistics for May 2025, which give employment and wages for every occupation in DFW [3], and the occupational exposure scores published in Science by researchers from OpenAI and the University of Pennsylvania (Eloundou et al., 2024), which estimate the share of each occupation’s tasks that large language models and complementary tools can complete at least twice as fast [4]. We define occupations scoring 0.5 or higher as “highly exposed.”
The result (Figure 4, left): 31.2% of DFW jobs—about 1.19 million—are highly exposed, slightly above the U.S. (28.6%) and San Diego (29.8%) and below Boston (32.1%), consistent with the map’s “Medium” rating. The ranking does not hinge on the 0.5 threshold: using 0.4 or 0.6, or the paper’s human-rated scores, DFW always sits slightly above the nation and San Diego and slightly below Boston. Notably, the Brookings Institution’s 2025 map of the U.S. AI economy classifies DFW as an “AI Star Hub” [33]—DFW is both a user and a target of AI, and a hub of AI talent and firms.
What matters more is who is exposed (Figure 4, right). Exposure is highest for computer and mathematical occupations (0.76; about 196,000 workers), office and administrative support (0.59; about 476,000), and business and financial operations (0.55; about 283,000). The last two reflect DFW’s role as a headquarters and back-office center: customer service representatives (97,000), general office clerks (53,000) and administrative supervisors (46,000) are all large occupations here. Construction trades (0.13), food service (0.15), installation and repair (0.16) and transportation (0.17) are barely affected—and those are exactly the jobs the data-center and housing booms need.
3.2 Early Evidence from the Texas Labor Market
This is not a hypothetical. A September 2026 Dallas Fed study of millions of Texas job postings from Lightcast found that after ChatGPT’s release, postings for occupations whose tasks are more automatable fell about 5% relative to less-exposed occupations by late 2023 and about 8% by the first quarter of 2025; AI automation exposure is estimated to have reduced total Texas postings by about 1.8% in 2024 and 2.6% in 2025 [5]. A companion paper finds that among Texas college graduates, each 10-percentage-point increase in a major’s share of automatable tasks lowers the probability of finding a Texas job within a year by 1.7 percentage points, and those who do find jobs earn about 5% less [6].
3.3 Transmission to Housing Demand
The question for DFW housing is not “how many jobs disappear” but “does the marginal buyer’s income change?” Our assessment:
- Entry-level white-collar workers are squeezed. Customer service, clerical and junior analyst roles are the backbone of first-time buyers in the $250,000–$400,000 range. Slower hiring for them directly weakens demand at the low end—consistent with the finding in §7 that the cheapest ZIP codes fell the most.
- Senior roles are broadly stable. Management (0.47) and healthcare practitioners (0.35) have moderate exposure, and AI tends to raise their productivity rather than replace them. They support high-priced homes in top school districts.
- Build-out jobs benefit. Data centers, the grid, factories and housing itself require on-site workers that AI cannot easily replace. They earn decent wages but mostly rent or buy lower-priced new homes, adding to new supply and rental demand rather than demand for high-end resale homes.
So AI does not mean “DFW prices fall across the board” or “rise across the board.” It widens the divergence: low-end demand weakens while the top end stays comparatively steady.
The timing should be gradual. In the Dallas Fed’s May 2026 Texas business survey, two-thirds of responding firms said they use AI, up from 40% two years earlier [5]. But firms’ first response is mostly to hire fewer people rather than to lay people off—fewer openings and a harder market for new graduates rather than mass unemployment. For housing, that means the pool of marginal buyers shrinks year by year rather than a sudden wave of forced sales. In a well-supplied market like DFW, that slow erosion shows up mainly as a long sideways drift and slower absorption at the low end.
4. Housing Effects of Data-Center and Energy Infrastructure
4.1 Scale of Investment
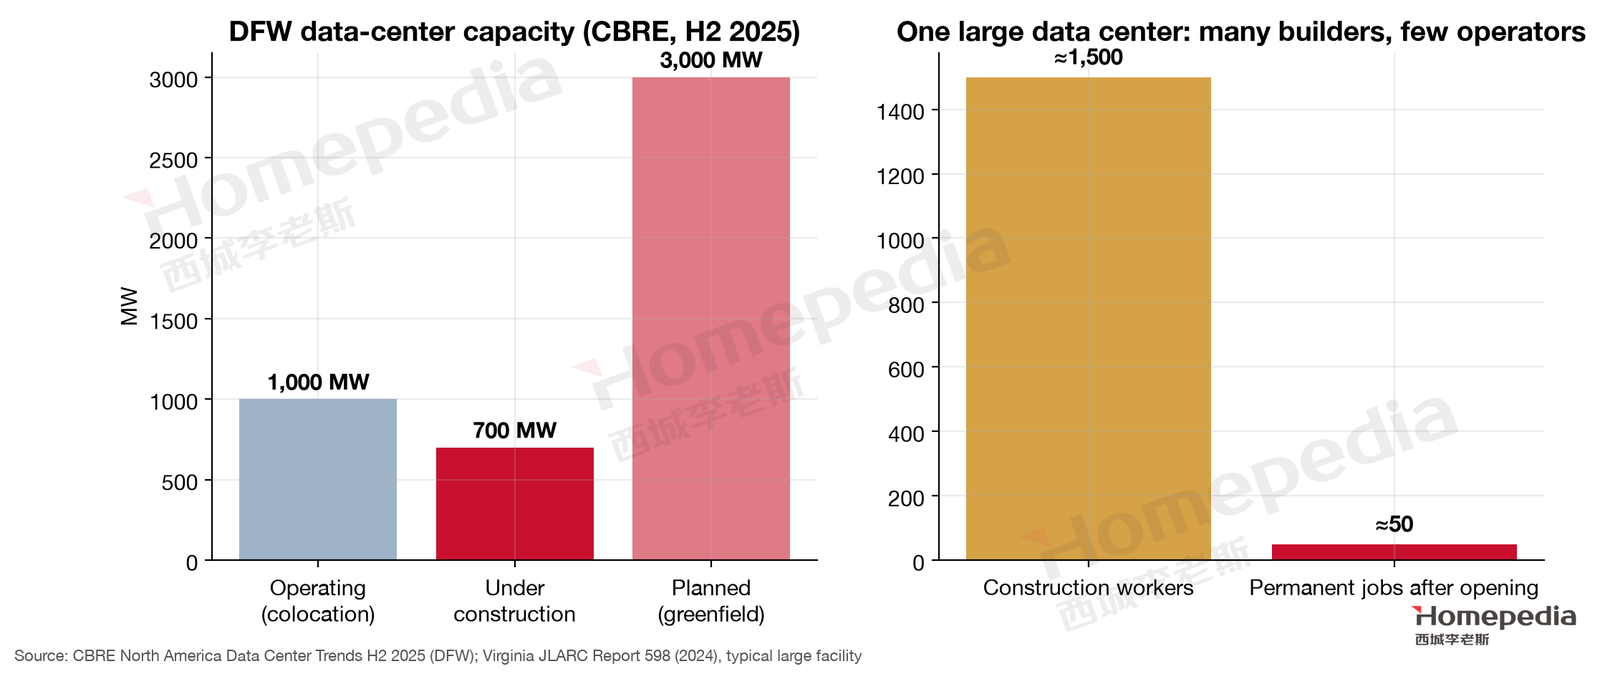
DFW is one of the largest data-center markets in the country. CBRE reports that as of the second half of 2025, DFW had about 1 GW of colocation capacity with just 2.4% vacancy, about 700 MW under construction (94.5% preleased), and about 3 GW of greenfield development planned [18]. Google continues to expand its campuses in Ellis County south of Dallas (Midlothian and Red Oak) [27], and Texas Instruments began production in December 2025 at its roughly $40 billion 300-mm wafer fab in Sherman, on DFW’s northern edge, with plans for up to 3,000 direct jobs [26].
Statewide the numbers are even larger. As of June 2026, ERCOT’s large-load interconnection queue totaled 438 GW, about 90% of it from data centers [19]. Texas data-center construction reached $10.7 billion in 2025—5.7% of all construction value in the state and second only to Virginia [7].
4.2 Employment Structure and Housing Pass-Through
Some sobriety is needed here. Data centers are capital-intensive, not labor-intensive. A study by Virginia’s Joint Legislative Audit and Review Commission (JLARC) found that a typical large data-center project employs about 1,500 construction workers but only about 50 permanent workers once operating [20] (Figure 5, right). Individual DFW projects will differ, but “many builders, few operators” is characteristic of the industry.
For home prices this means:
- Construction-phase demand is temporary and skews toward renting. Construction crews mostly rent in lower-priced areas near job sites and move on to the next project. They support rental demand and lower-priced new-home absorption in southern and eastern counties such as Ellis and Kaufman, not high-end prices in the north.
- Permanent jobs are few but well paid. A handful of operations and power engineers earn high salaries, but in the tens or hundreds—not enough to move prices in a metro of 8.5 million.
- The geography is uneven. Data centers cluster where land is cheap and power is accessible—southern and outer counties such as Ellis and some northern industrial corridors—so their support for nearby housing is local, not metro-wide.
- The durable benefit is power. Years of investment in generation, transmission lines and substations will affect land values (especially industrial land near substations and transmission corridors) far more than residential prices.
ERCOT’s new “batch zero” interconnection process underscores the point: data-center timing depends on grid planning. Applicants in the first batch were notified in August 2026, the final transmission plan is due in fall 2027, and most projects expect to be operating by 2030 [19]. The data-center boost to DFW will be a slow five-to-ten-year process, not a one-time demand shock—slow enough for homebuilders to keep pace.
So the map’s “High” infrastructure rating is right—this is a genuine tailwind for DFW’s economy—but readers should not treat data-center headlines as a signal that home prices will rise.
5. The Marginal Buyer: Migration and Purchasing Power
Prices are set by the marginal buyer—the person deciding whether to buy at today’s price. DFW’s marginal buyer is changing in three ways.
5.1 Components of Population Growth
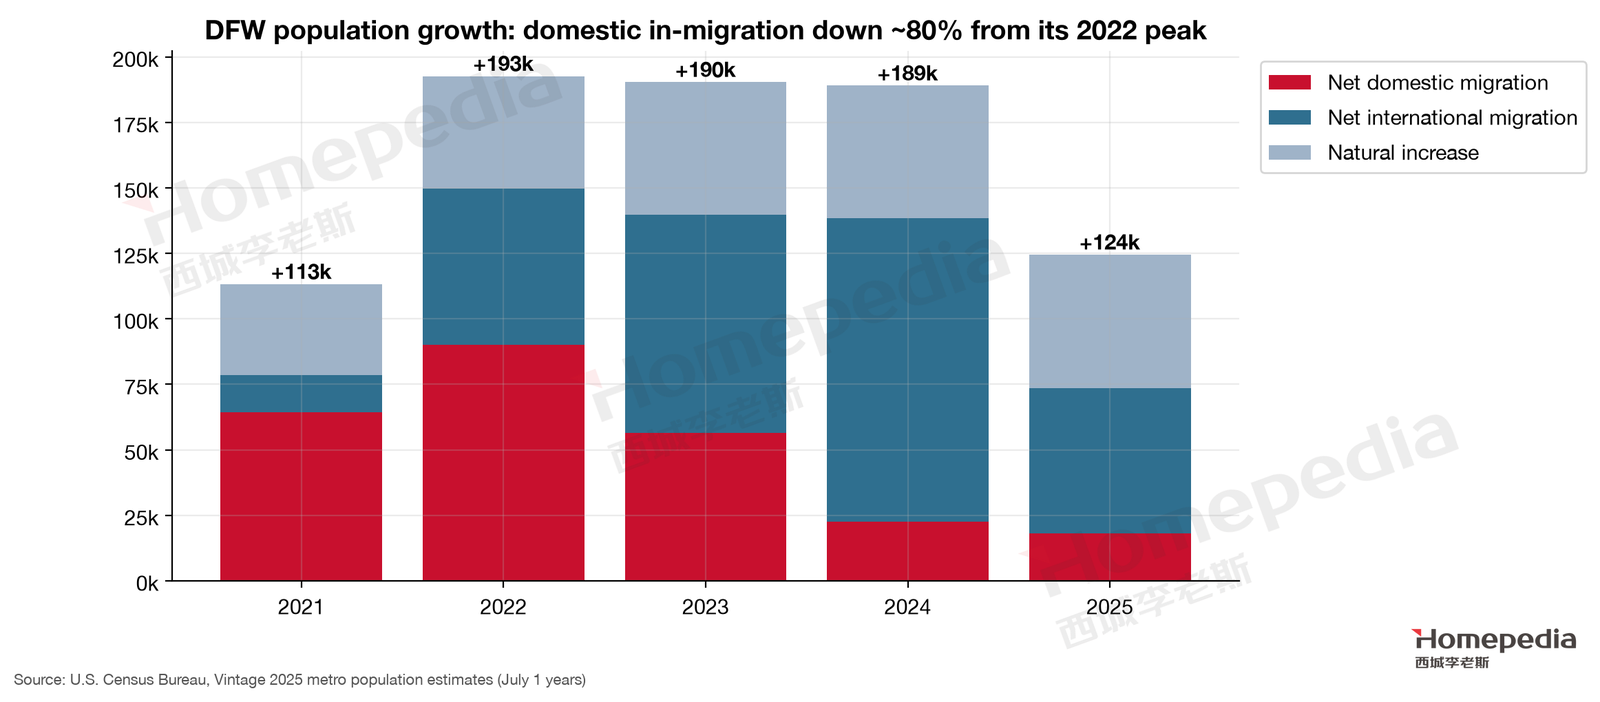
Census Vintage 2025 estimates show DFW’s population rising from 7.67 million in 2020 to 8.48 million in 2025, about 810,000 more people in five years [14]. But the mix is shifting (Figure 6). Net domestic migration fell from 90,000 in 2022 to 18,000 in 2025, down about 80%; net international migration fell from 116,000 in 2024 to 55,000 in 2025; natural increase is steady at about 50,000 a year. DFW still added about 124,000 people in 2025, but that is more than a third below 2022.
Dallas Fed data confirm the trend statewide: Texas net international migration fell from 355,000 to 167,000 in 2025 and net domestic migration from 86,000 to 67,000; job growth for the year was just 0.1%, with the Dallas Fed forecasting a rebound to 1.1% in 2026 [7].
5.2 Income of In-Migrating Households
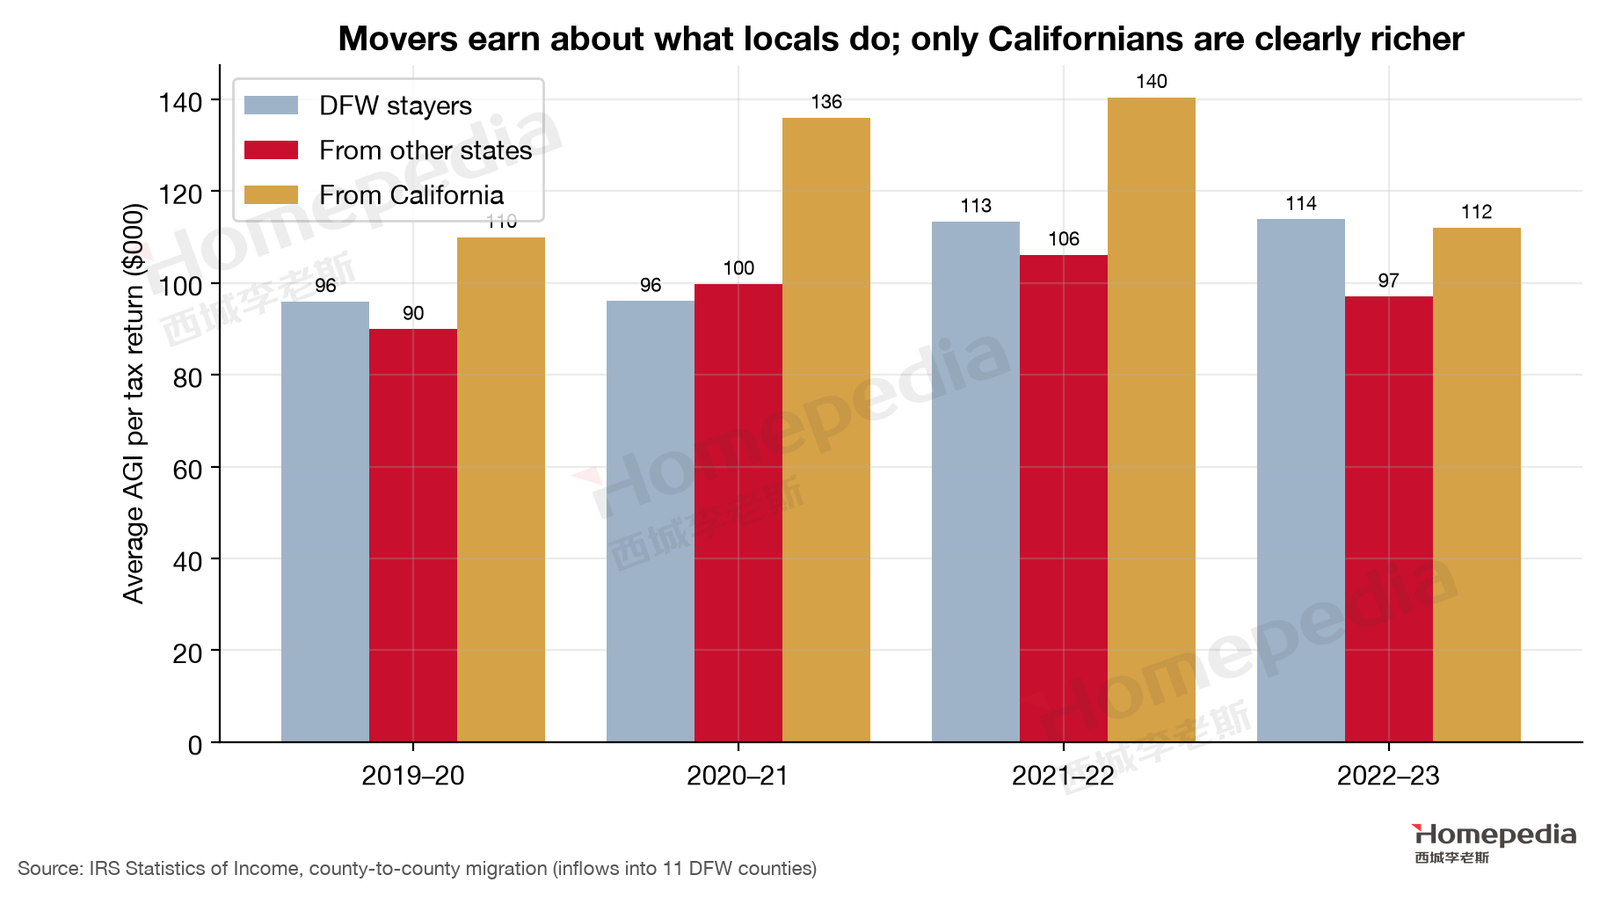
“Californians cashing out and bidding up Texas homes” is a familiar story. IRS county-to-county migration data let us test it directly [16]. In tax year 2022–23, 67,000 households moved into DFW’s 11 counties from other states, with average adjusted gross income (AGI) of $97,000—below the $114,000 of households that stayed put (Figure 7). Only Californians were clearly richer: $140,000 on average in 2021–22, falling to $112,000 in 2022–23 as their numbers dropped from 16,000 to 13,000 households.
Movers tend to be younger than stayers, so part of the income gap is age. But that is precisely the point: in-migration mainly adds demand for lower-priced homes and rentals, not for the high end. This is what the map means by a “modest gain” in affluent marginal buyers: migration continues, but movers as a group have no more purchasing power than locals, and the peak of high-income California migration has passed.
5.3 Housing Affordability
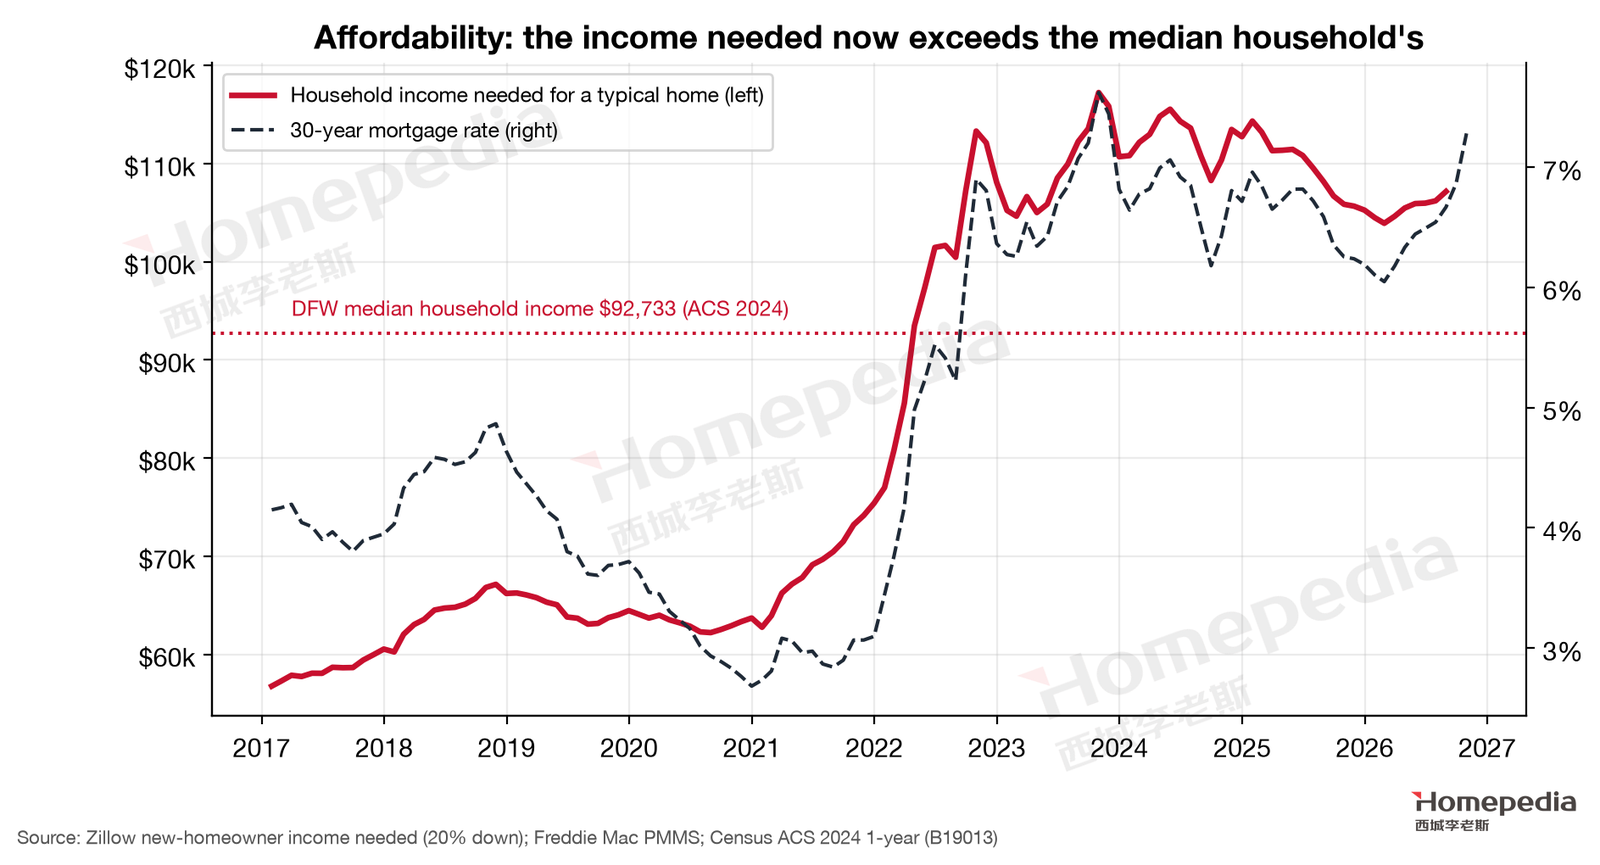
Zillow estimates that buying a typical DFW home with 20% down, keeping payments under 30% of income, required household income of about $107,167 in August 2026, versus $64,458 in December 2019 [11]. DFW’s median household income is $92,733 (2024 American Community Survey) [15]—a median-income household can no longer afford a median-priced home. As early as 2023, the Dallas Fed noted that the share of homes affordable to median-income families in Dallas and Austin had fallen from about 60% in 2014 to under one-third [8].
Rates are the other half of the problem. Freddie Mac’s survey put the 30-year fixed rate at 7.28% on October 1, 2026, up 0.33 percentage points in two weeks [17]. Rates briefly touched 5.98% in late February 2026, a more-than-three-year low, then climbed to a 52-week high by early October [17]. When rates eased early in the year, sales briefly picked up (the Texas Real Estate Research Center recorded statewide sales up 8.6% year over year in June [32]), but that revival is unlikely to last with rates moving higher again. At these rates DFW buyers are extremely price-sensitive, which is why builders keep offering large incentives (§7).
Box 1. Monthly Carrying Cost of a Typical Home
At DFW’s August 2026 typical value of $360,437, with 20% down (about $72,000), a loan of about $288,000 and a 7.28% 30-year fixed rate:
- Principal and interest: about $1,973 per month
- Property tax (at a 1.7%–2.2% combined rate): about $511–661 per month
- Homeowners insurance (assuming $2,500–3,500 a year): about $208–292 per month
- Total: roughly $2,700–2,900 per month (before HOA and maintenance)
By comparison, a typical DFW single-family rental is about $2,371 a month and a typical apartment about $1,498 [11]. At today’s rates, owning a typical single-family home costs about $300–550 more per month in cash than renting a similar one—plus a $72,000 down payment.
Compare with late 2019: the same home was worth about $262,000, the average rate was 3.72%, and with 20% down the principal and interest was about $968 a month. Prices rose 37.5%, but the payment more than doubled—rates are the main force keeping DFW buyers out. It also means that if rates fall meaningfully, pent-up demand will return quickly—the main trigger for our upside scenario.
Buyers comparing Texas with other states also tend to underestimate carrying costs. Texas has no state income tax, but property taxes are high: combined rates in DFW’s main counties range from roughly 1.7% (parts of Collin County) to over 2.2% (City of Dallas, parts of Tarrant County) [34]. With homeowners insurance up sharply in recent years, taxes and insurance on a $400,000 home can exceed $10,000 a year. Those costs directly reduce what buyers are willing to pay.
6. Housing Supply Elasticity and Price Transmission
This section is the core of the report.
Box 2. The Concept of Housing Supply Elasticity
Imagine two cities each receiving 10,000 new households. The first is ringed by mountains and ocean; its flat land is built out, and every new building faces two or three years of permitting and public hearings. The newcomers must compete for existing homes, so prices rise until some are priced out or give up. The second city is surrounded by flat, cheap farmland; local governments welcome development, and a builder can turn a field into a subdivision of several hundred homes in six months. When newcomers arrive, builders build more, and prices need to rise only a little to make that profitable.
Economists call the difference “supply elasticity”: the percentage increase in housing supply divided by the percentage increase in price. Low elasticity (San Diego’s 0.67) means demand mostly becomes higher prices; high elasticity (Dallas 2.18, Fort Worth 2.80) means demand mostly becomes new homes.
For investors, this means in a high-elasticity metro you cannot count on “the city is growing” to lift prices. The more attractive the metro, the more builders build. What you need are the low-elasticity pockets within the metro—built-out, established neighborhoods with no new lots, where new homes cannot compete directly. That is why this report keeps returning to divergence.
High elasticity does not mean prices never rise. When a demand shock arrives too fast—such as the 2020–2022 pandemic migration combined with ultra-low rates—builders’ capacity, labor and permitting cannot keep up, and prices jump even in elastic metros. DFW’s roughly 50% gain in 2020–2022 happened that way. The defining feature of elastic metros is that once the shock passes, supply catches up and prices give back gains or stall for years; inelastic metros “lock in” their gains.
6.1 Scale of New Housing Supply
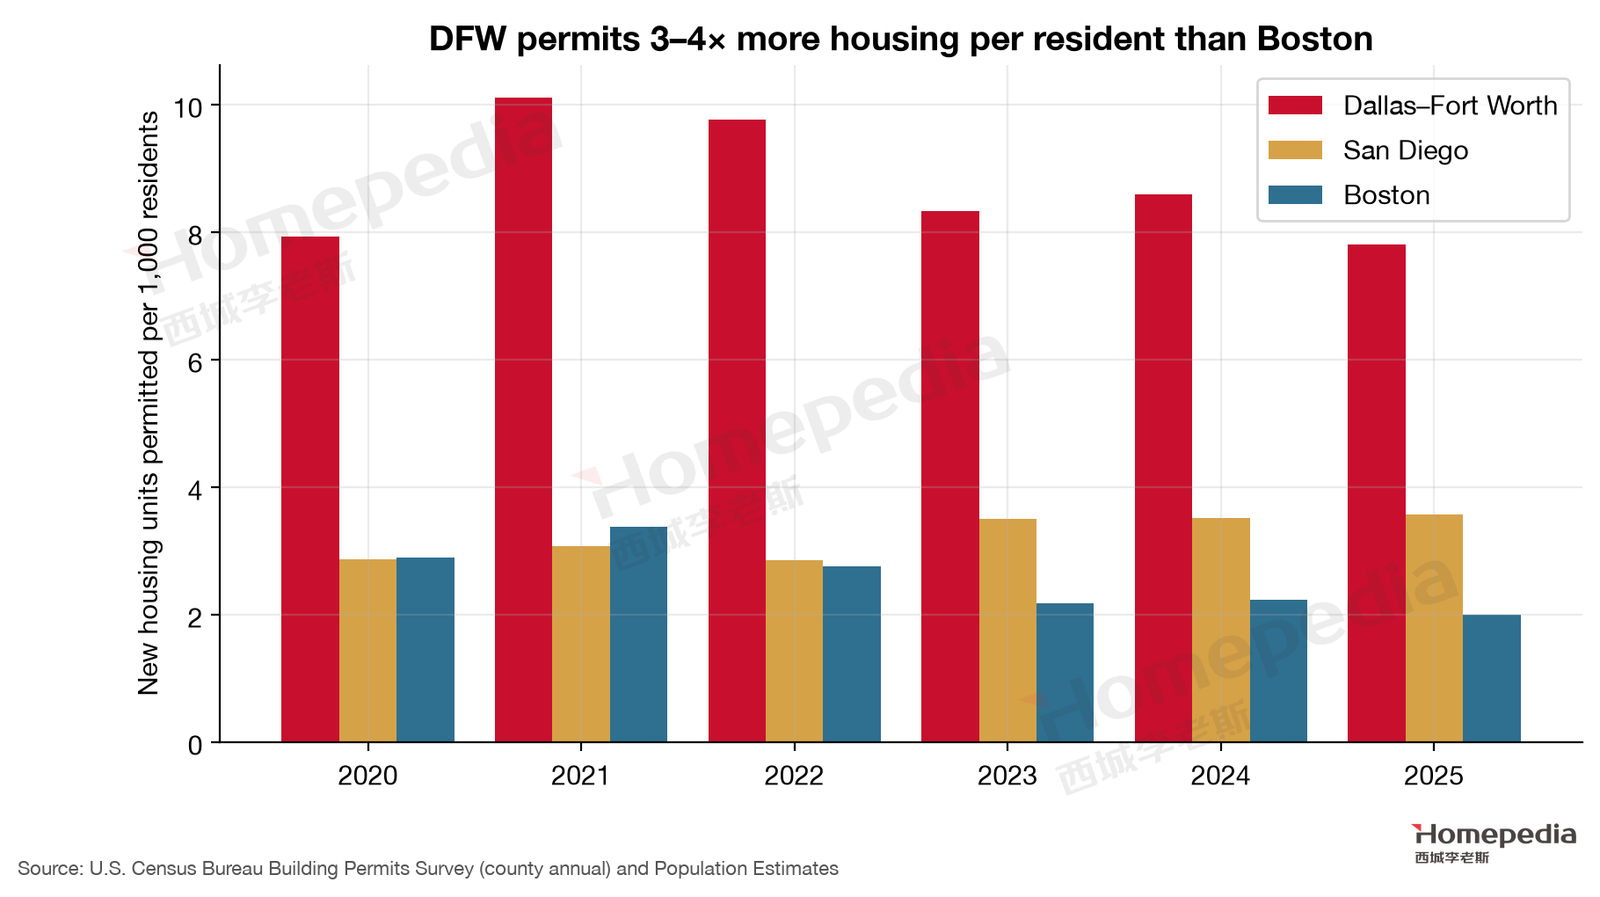
Census Building Permits Survey data show that DFW’s 11 counties permitted 423,440 housing units in 2020–2025, versus 76,574 in Boston’s seven counties and 63,614 in San Diego [13]. DFW has 1.7 times Boston’s population and 2.6 times San Diego’s, but permitted 5.5 and 6.7 times as many homes. Per capita (Figure 9), DFW permits 7.8–10.1 homes per 1,000 residents per year, Boston 2.0–3.4 and San Diego 2.9–3.6.
Even in high-rate 2025, DFW permitted 66,179 units, including 39,790 single-family homes. That is “demand arrives, bulldozers follow” in numbers.
6.2 Academic Estimates of Supply Elasticity
The most-cited estimates come from Albert Saiz of Wharton, published in 2010 in the Quarterly Journal of Economics, a top economics journal. Using terrain (the share of developable land) and regulation, he estimated long-run supply elasticities for 95 large U.S. metros [9]:
| Metro | Supply elasticity (Saiz 2010) | Rank among 95 metros (1 = hardest to build) |
|---|---|---|
| San Diego | 0.67 | 5th |
| Boston | 0.86 | 15th |
| Dallas | 2.18 | 63rd |
| Fort Worth–Arlington | 2.80 | 82nd |
Dallas’s elasticity is 3.3 times San Diego’s; Fort Worth’s is 4.2 times.
6.3 Supply Elasticity and Long-Run Appreciation
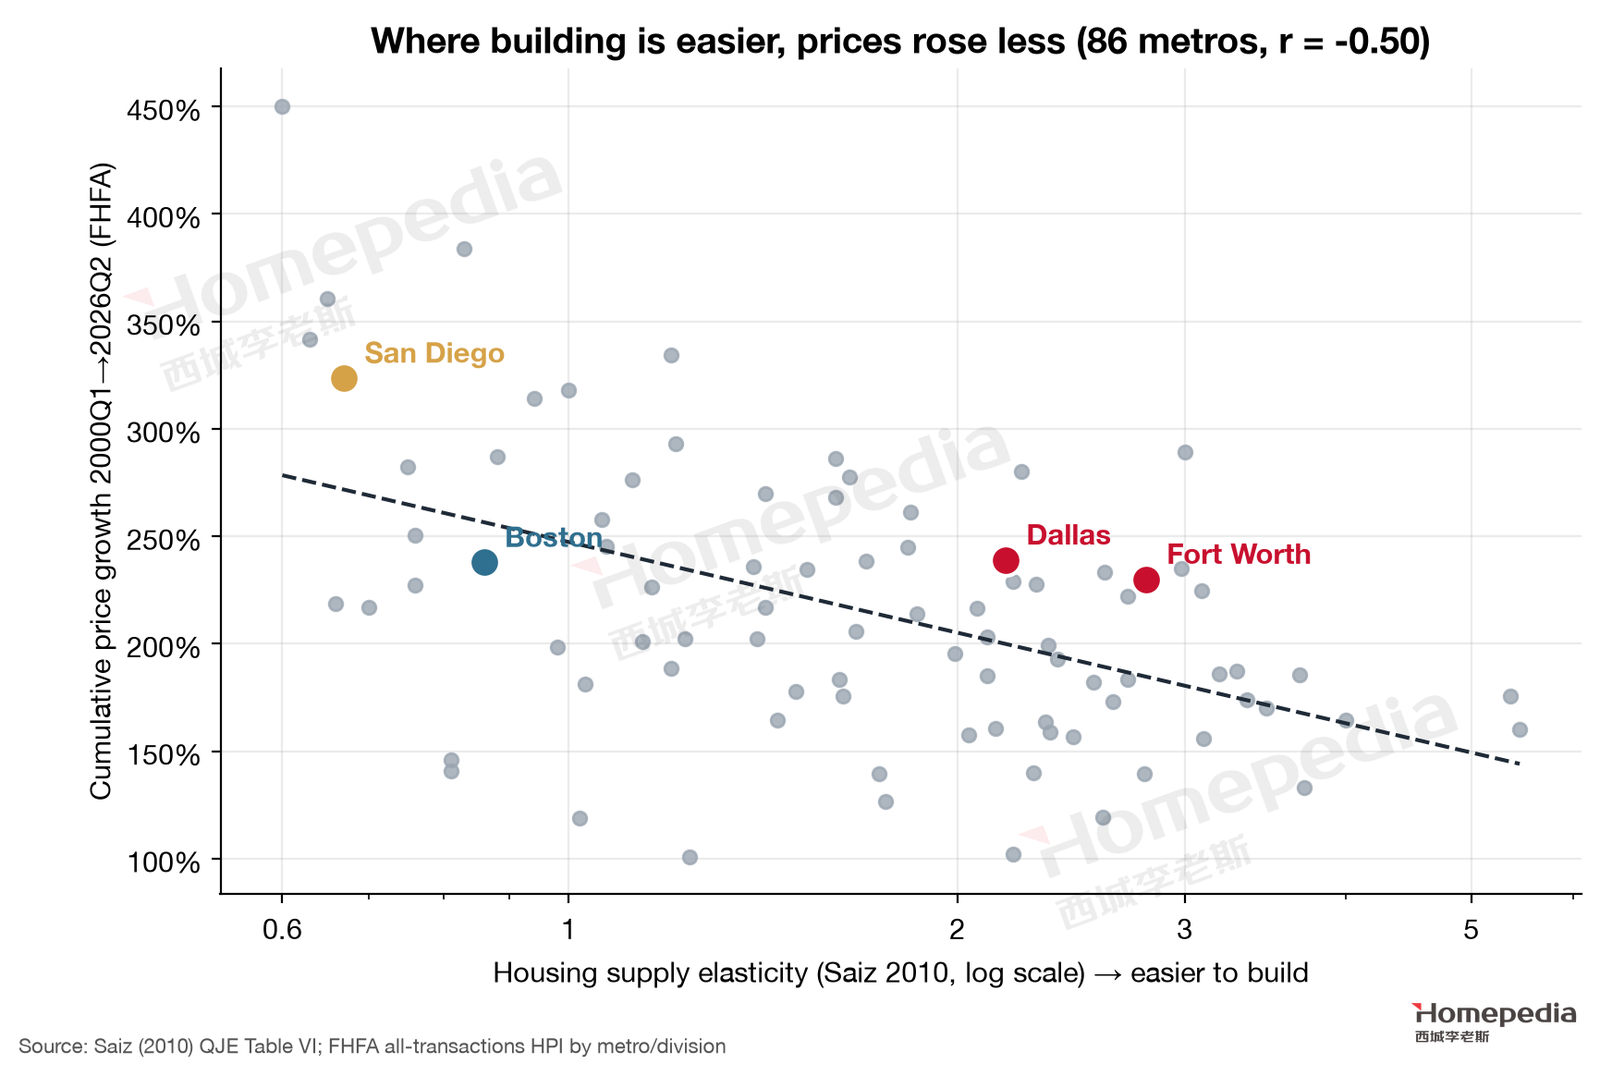
To check whether the mechanism shows up in practice, we matched Saiz’s elasticities to the Federal Housing Finance Agency (FHFA) house price index for 86 metros and compared cumulative gains from 2000Q1 to 2026Q2 [9][10]. The result (Figure 10) is clear: the more elastic the metro, the less prices rose over 26 years (correlation −0.50). San Diego (elasticity 0.67) rose 324%, at the top left of the chart.
One detail must be confronted: Dallas (+239%) and Fort Worth (+230%) both sit above the trend line, and Dallas’s long-run gain roughly matches Boston’s (+238%). We read this as illustrating both halves of Wei Li’s thesis. DFW’s demand was exceptionally strong—strong enough for an elastic metro to post an inelastic metro’s gains. But precisely because supply is elastic, those gains came in bursts when supply fell behind (the 2012–2022 population and job boom), and once supply caught up, prices stalled or corrected. The post-2022 path (§7) is what supply catching up looks like. DFW also started from a much lower base: the same percentage gain took a Dallas home from about $100,000 to $360,000, but a Boston home from about $200,000 to $730,000—very different pressure on household budgets.
6.4 Employment Growth and Price Growth Compared
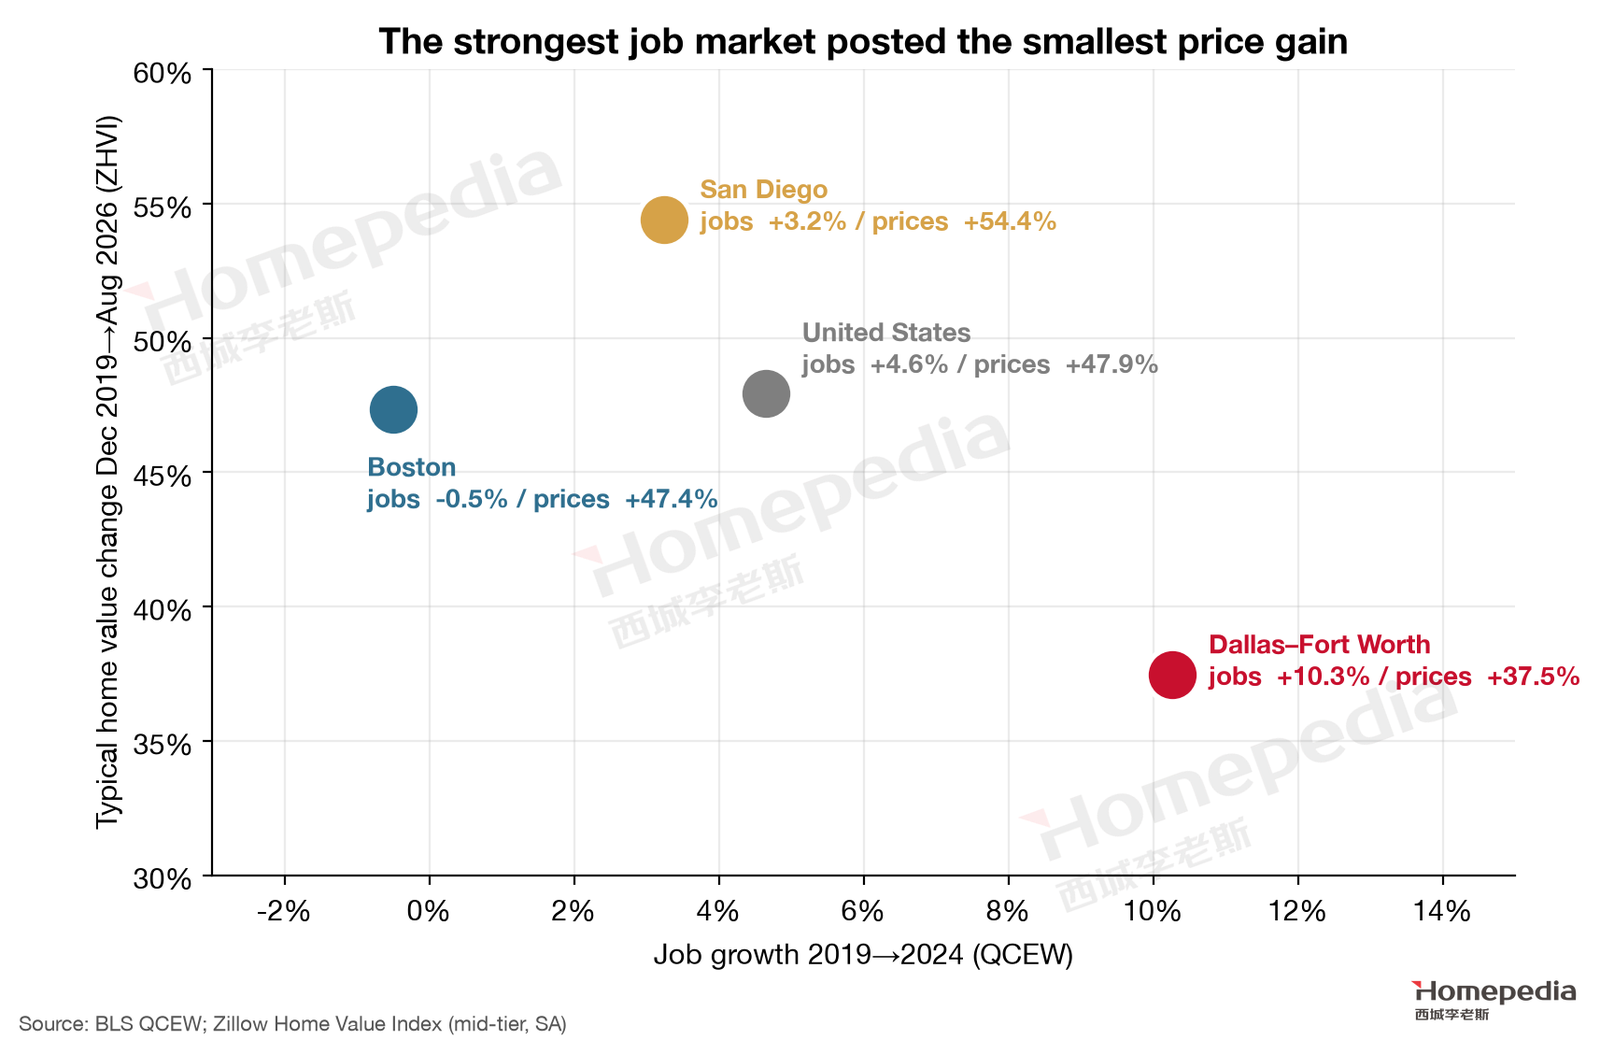
Put demand and prices on one chart (Figure 11) and DFW stands out: of the four areas compared, it has the highest job growth (+10.3%) and the lowest price growth (+37.5%). Boston’s jobs were flat, yet prices rose 47.4%; San Diego’s jobs grew 3.2%, yet prices rose 54.4%. Note that Figure 11’s price window runs through August 2026. Over the same window as the job data (through December 2024), DFW rose 45.7%, in line with Boston (44.0%) and the nation (46.9%) and below San Diego (57.6%). Both windows tell the same story: DFW’s job growth was several times larger, yet its prices did not rise more. This is what supply elasticity looks like in practice: in supply-constrained metros demand becomes prices; in DFW it becomes houses.
6.5 Cross-Metro Regression: Price Transmission Conditional on Demand
A four-way comparison could be coincidence. For a stricter test we combined Saiz’s elasticities with QCEW job growth and FHFA prices for 73 large U.S. metros and asked how much price growth a given amount of job growth produces in metros of different elasticity [1][9][10].
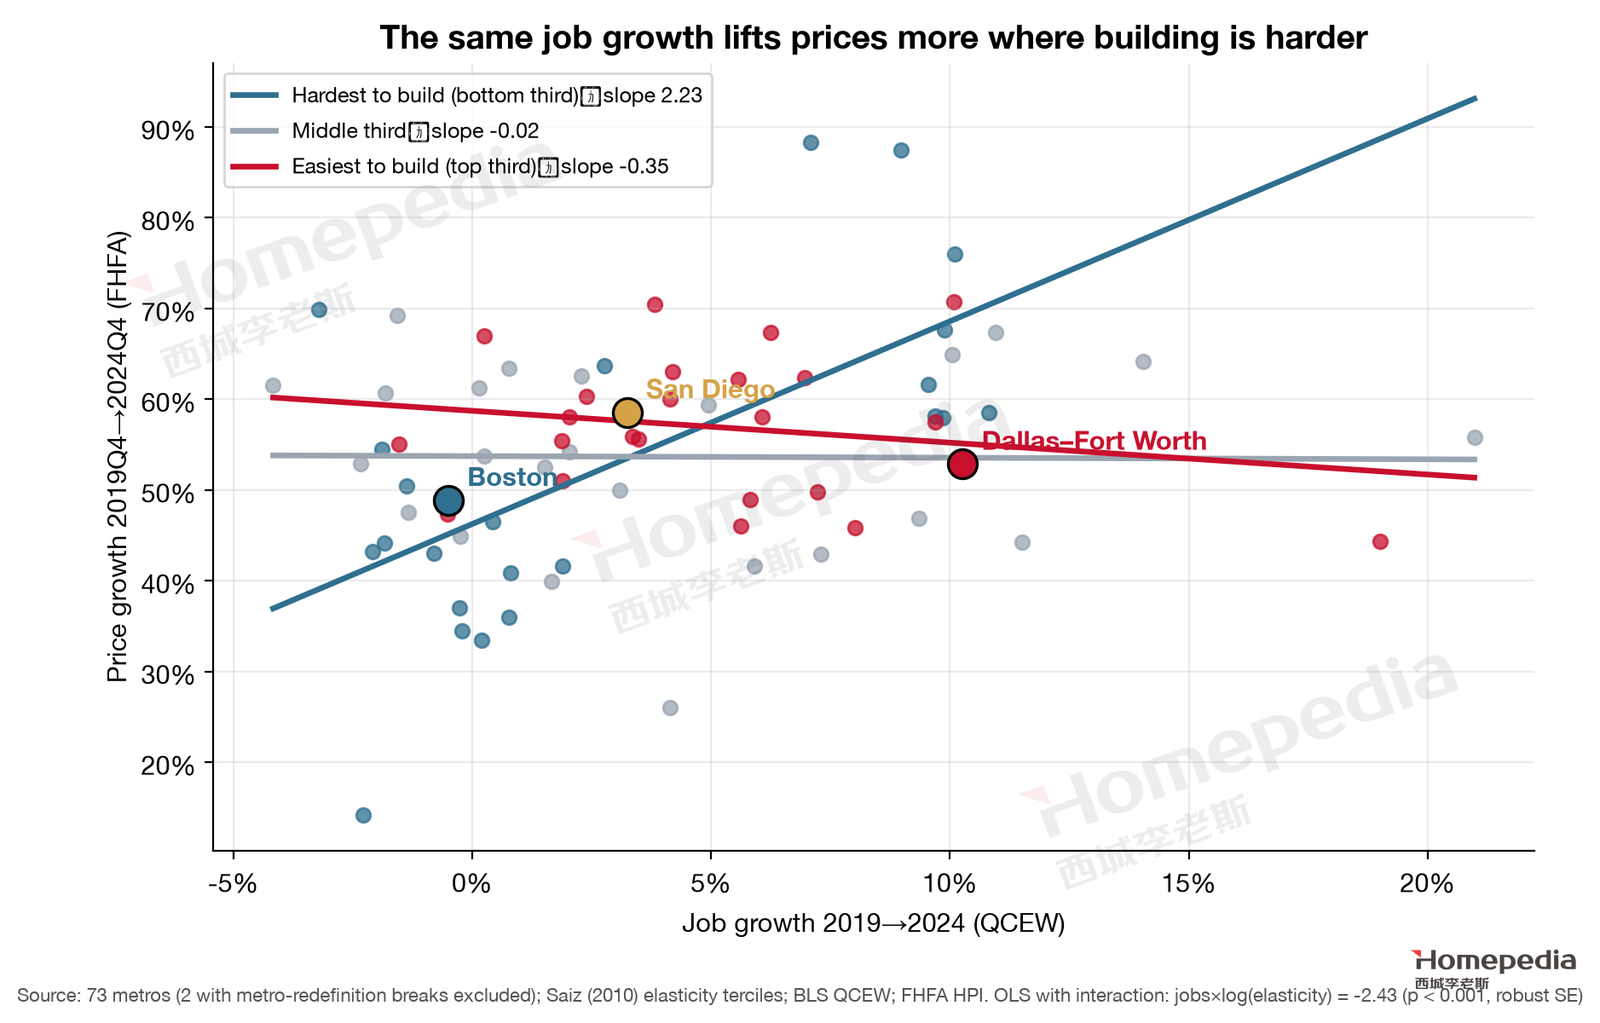
The result is clear (Figure 12). Splitting the 73 metros into elasticity terciles: in the hardest-to-build third, job growth and price growth are strongly positively related (slope about 2.2); the middle third’s slope is close to zero; in the easiest-to-build third, the slope is negative (about −0.35). A formal regression of price growth on job growth, elasticity and their interaction yields an interaction coefficient of −2.43, highly significant (p < 0.001). In plain terms:
- In a metro like San Diego (elasticity 0.67), each additional percentage point of job growth adds about 2.9 points of price growth;
- in Boston (0.86), about 2.3 points;
- in Dallas (2.18), about zero—job growth barely translates into price growth.
The model predicts DFW’s 2019–2024 price growth at 53.3%; the actual figure was 52.9%. Give DFW San Diego’s elasticity and the same 10.3% job growth predicts about 71% price growth—roughly 18 percentage points more than actually occurred. Those 18 points are the price gains DFW’s supply capacity “absorbed” on behalf of buyers.
One further finding deserves mention. In the same regression, the coefficient on elasticity itself is positive: since 2019, cheap, easy-to-build inland metros rose more overall—the result of pandemic-era remote work pushing people toward low-cost metros. Without controlling for job growth, elasticity and post-2019 price growth are even positively correlated (about +0.25). This does not overturn the role of supply elasticity; it shows that two things are true at once: cheap metros attracted more people, but the easier it is to build, the less each unit of new demand raises prices. DFW has both: it attracted heavy in-migration and absorbed most of that demand with new homes.

7. Empirical Evidence of Price Divergence
If supply is absorbing demand, we should see two things: flat overall prices, and widening gaps between places where new supply can reach and places where it cannot. Both are happening.
7.1 Aggregate Price Trends
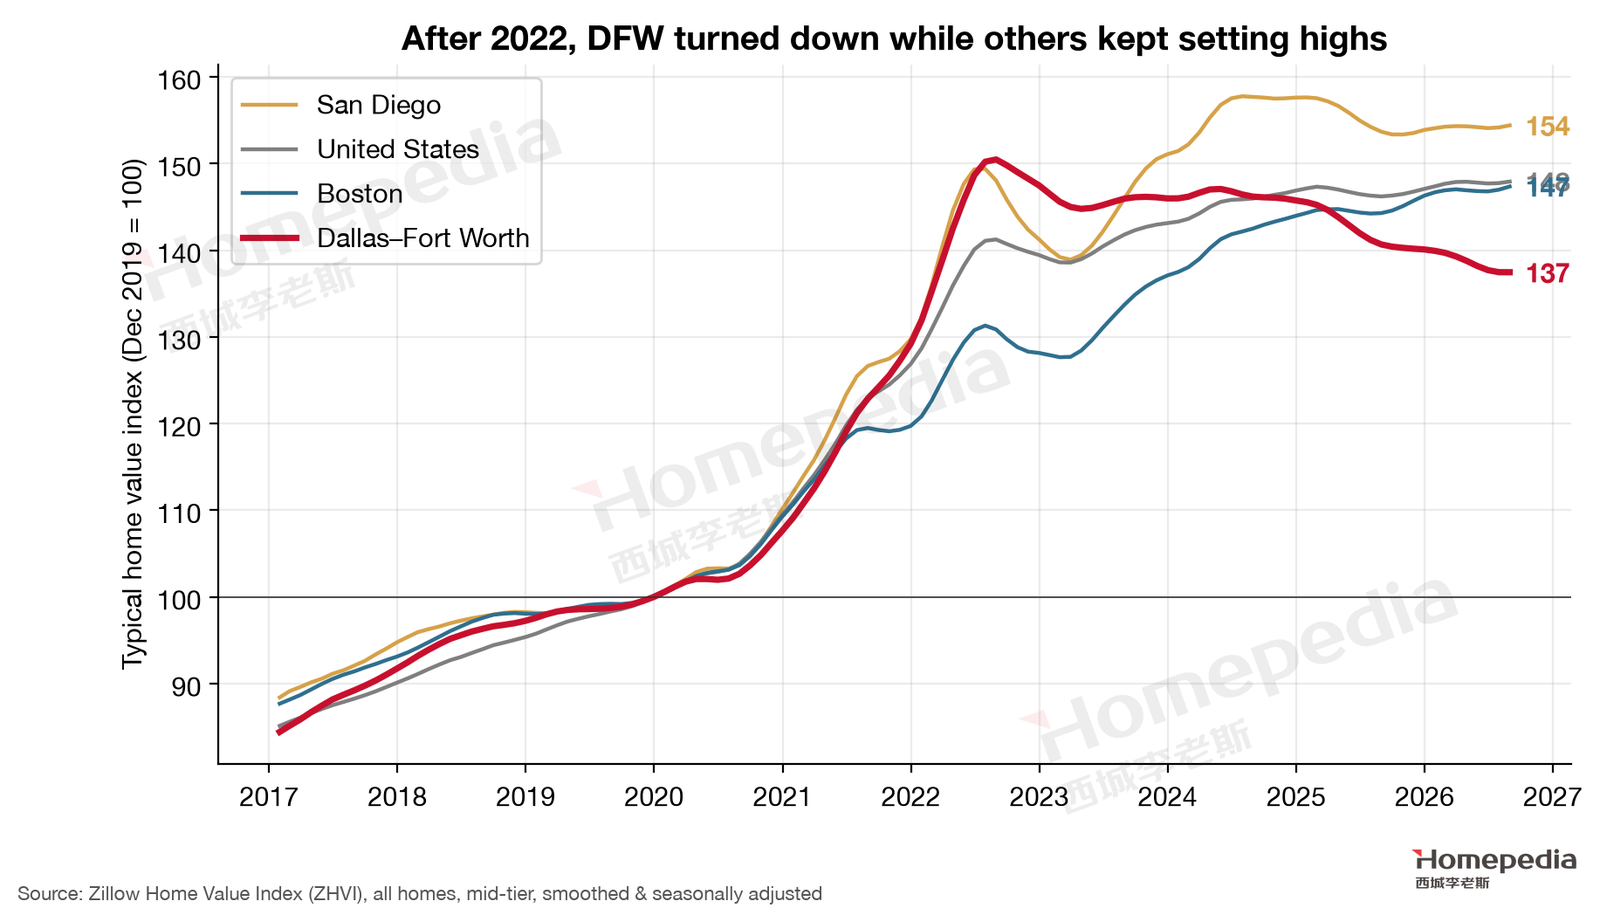
The Zillow Home Value Index (ZHVI) shows DFW’s typical value peaking in August 2022 ($394,541) and drifting down since, to $360,437 in August 2026—8.6% below peak and 2.3% below a year earlier [11]. Boston ($733,574) and the U.S. ($368,697) are at record highs, and San Diego ($930,785) is just 2.1% below its peak (Figure 14). DFW’s typical home is now cheaper than the U.S. typical home.
The FHFA repeat-sales index paints a similar but milder picture: through 2026Q2, the Dallas division is 54.9% above 2019Q4 and the Fort Worth division 53.9%, below the Boston division (58.4%) and San Diego (64.3%) [10]. The indexes differ in method (FHFA covers repeat sales with conforming mortgages), but they point the same way.
7.2 Dallas and Fort Worth Divisions Compared
FHFA splits DFW into the Dallas–Plano–Irving and Fort Worth–Arlington–Grapevine divisions. Their gains since late 2019 are nearly identical (54.9% vs. 53.9%), as are their long-run gains since 2000 (239% vs. 230%) [10]. The Texas Real Estate Research Center reports that Fort Worth–Arlington has posted several consecutive months of small year-over-year gains, while declines in Dallas–Plano are narrowing [32]. In other words, DFW’s divergence is not mainly between Dallas and Fort Worth; it is within each division—between established neighborhoods and new-construction zones, and between high- and low-priced homes.
7.3 Inventory and Seller Bargaining Power
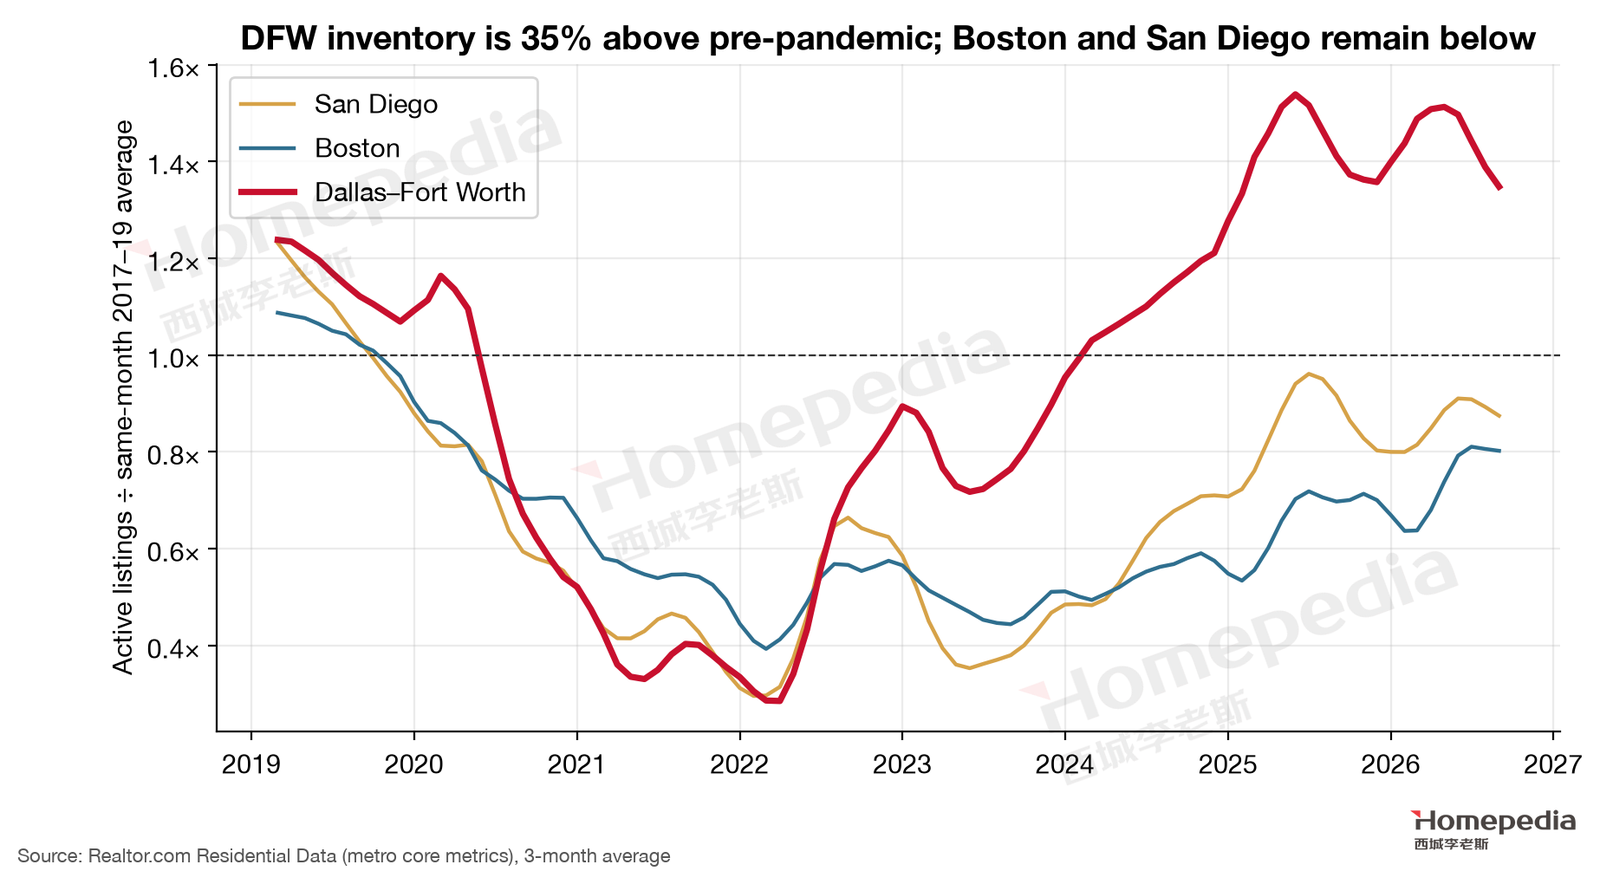
Realtor.com data show 29,364 active listings in DFW in September 2026. Compared with the 2017–2019 average for the same months, DFW inventory over the last three months ran about 35% higher, while Boston was at 80% of its pre-pandemic level and San Diego at 88% (Figure 15) [12]. Notably, DFW inventory is 2.3% lower than a year ago and new listings are down 2.4%—the rapid build-up has stopped, and the market is moving sideways at a buyer-leaning level, consistent with the Texas Real Estate Research Center’s observations [32].
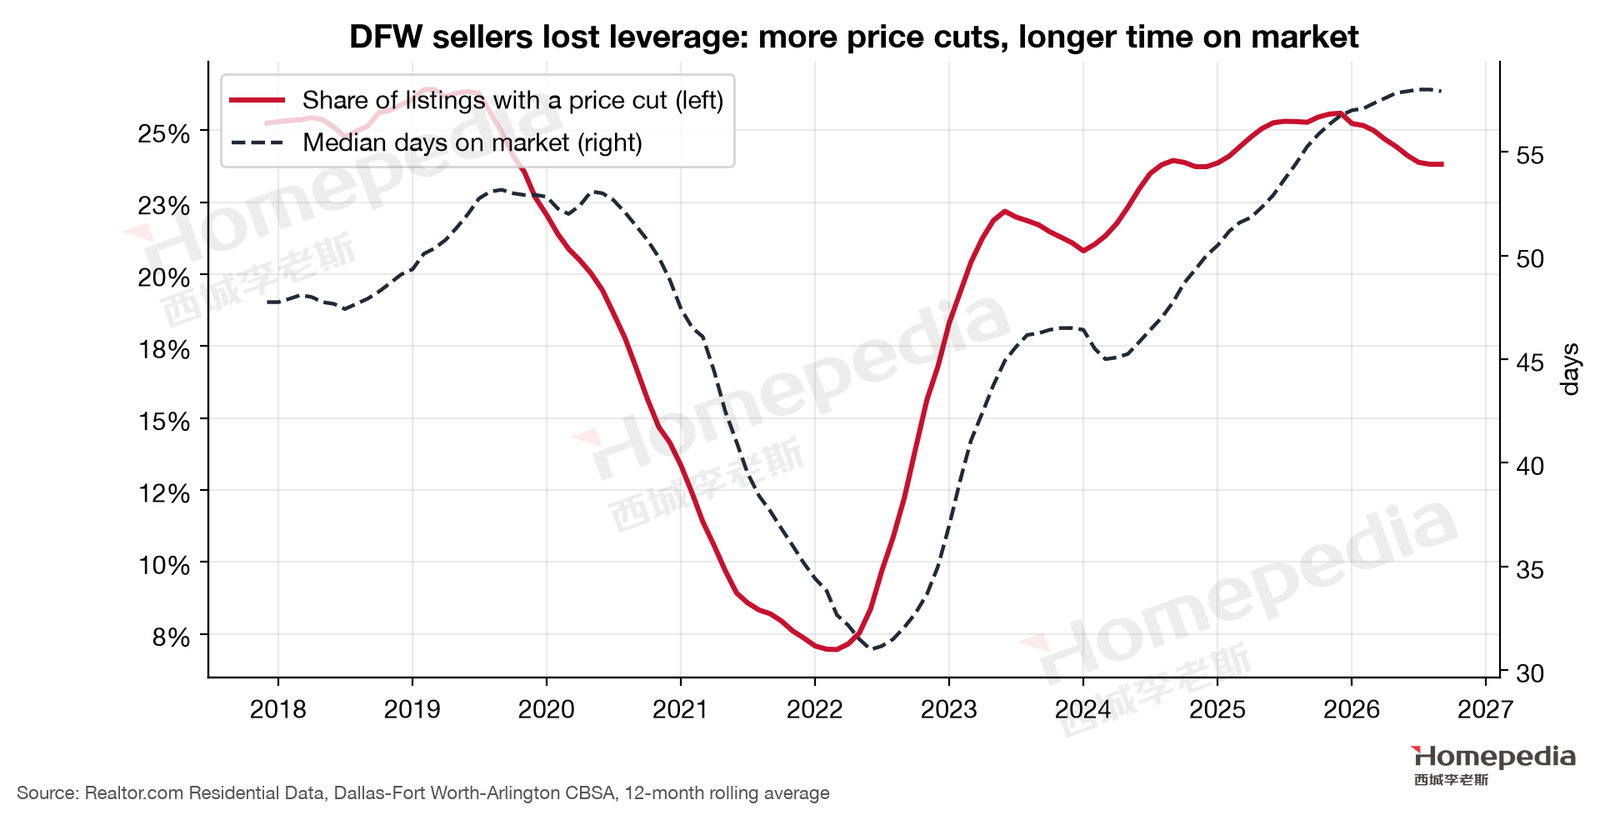
Seller leverage has weakened noticeably (Figure 16). In September 2026, 27.5% of DFW listings had a price cut and the median listing had been on the market 62 days, versus a 2017–2019 average of 50 days [12]. On a 12-month basis, both measures are back above their 2018–2019 highs.
7.4 Divergence by Price Tier
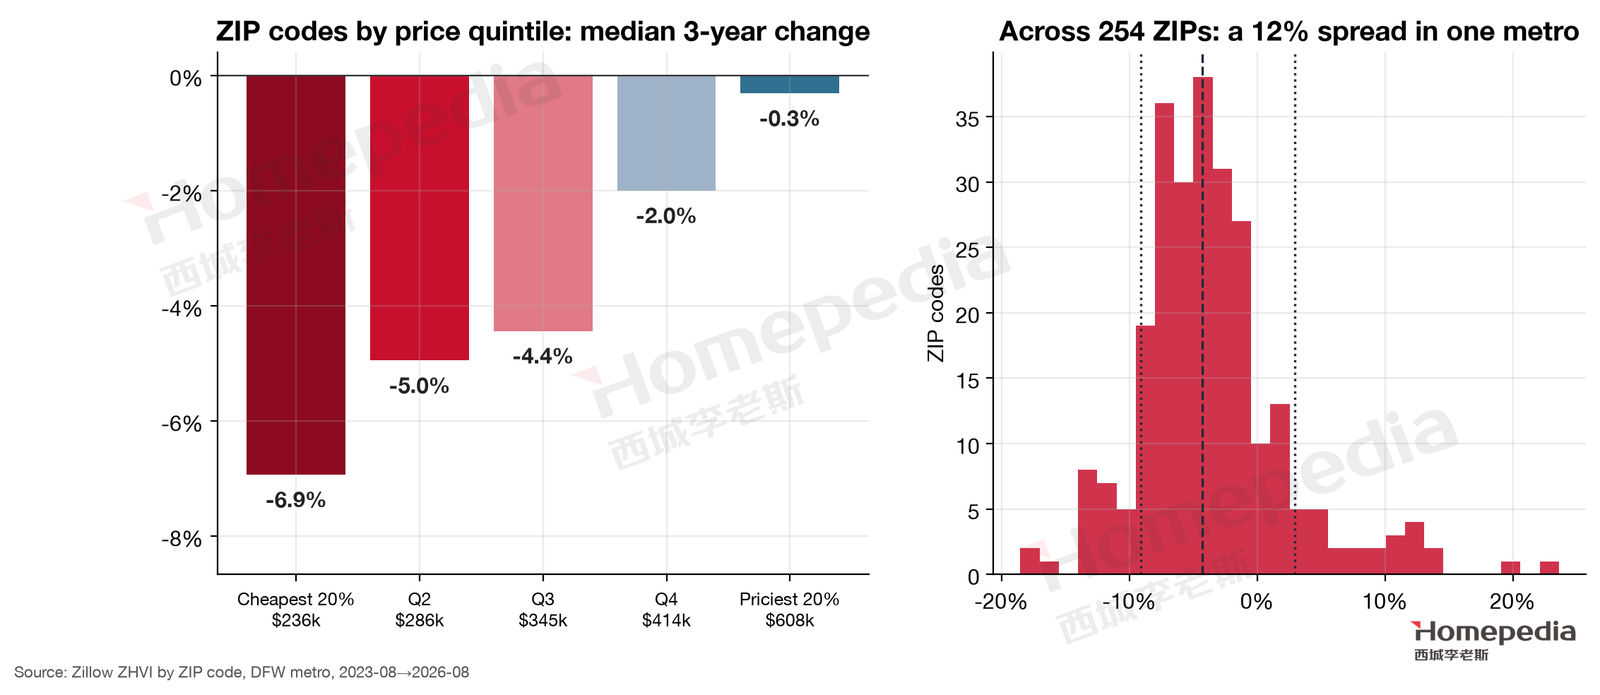
Divide DFW’s 254 ZIP codes with complete data into fifths by price and compare August 2023 with August 2026 (Figure 17, left). The cheapest fifth (median about $236,000) fell 6.9%, the second fifth 5.0%, the middle 4.4%, the fourth 2.0%, and the most expensive fifth (median about $608,000) only 0.3% [11]. Within one metro, the 10th-percentile ZIP fell 9.1% and the 90th-percentile ZIP rose 2.9%—a 12-point spread (Figure 17, right).
Could this simply be mean reversion—cheap areas rose more during the pandemic and are now giving it back? The data say no: since late 2019, DFW’s bottom tier is up 40.3% and its top tier 43.0%; the bottom tier did not rise more [11].
The gradient is strikingly regular, and it fits the mechanisms above. The low end is where builders’ new homes concentrate (D.R. Horton’s average closing price in its fiscal 2026 third quarter was about $362,000 [28]) and where entry-level white-collar buyers—the first to feel AI—shop. The high end is concentrated in established neighborhoods and top school districts that new construction cannot replicate, with buyers whose incomes are more stable.
7.5 Geographic Divergence
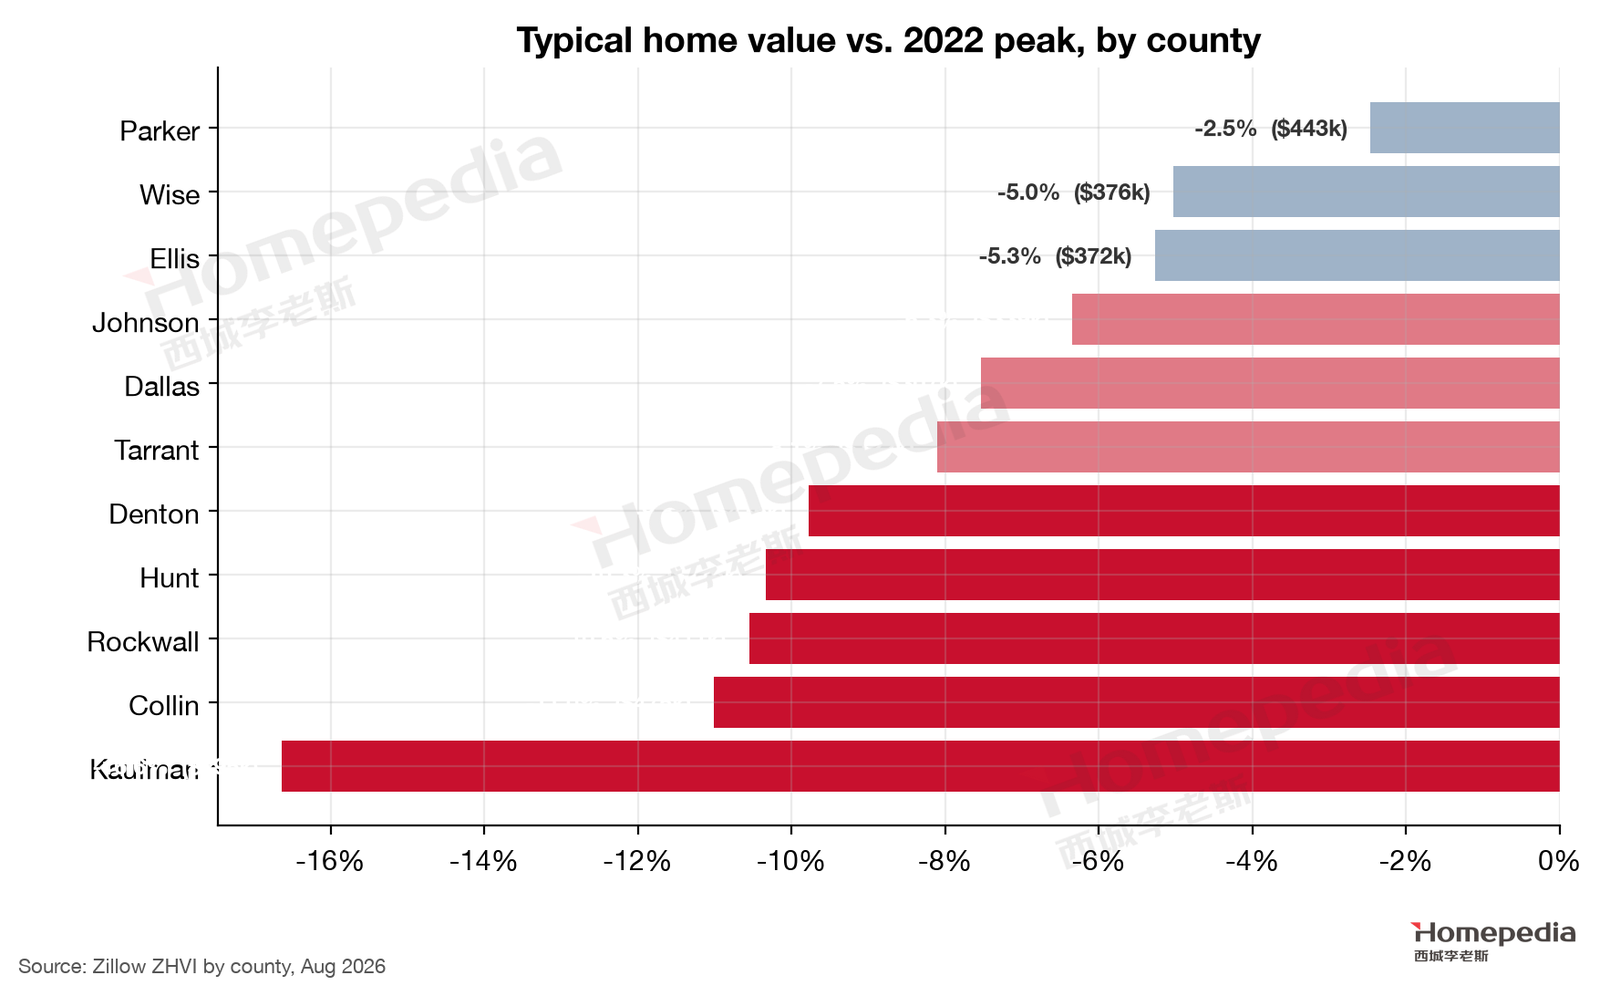
County-level divergence also points to supply (Figure 18). The largest decline from the 2022 peak is in Kaufman County to the east (−16.6%), one of the most active new-construction exurbs, followed by Collin (−11.0%), Rockwall (−10.6%), Hunt (−10.3%) and Denton (−9.8%). The smallest declines are in Parker (−2.5%) and Wise (−5.0%) to the west and Ellis (−5.3%) to the south [11].
Collin County is the clearest example: DFW’s fastest-growing job market (+26.8%) is among its deepest corrections. That is consistent with the supply explanation—the northern suburbs are also where new communities are most concentrated; demand is strong, but supply is stronger. Some will argue Collin fell more because its homes are pricier and more rate-sensitive, but across DFW the top price tier was actually the most resilient (−5.7% from peak), so high prices alone are not the explanation.
7.6 Divergence by Property Type
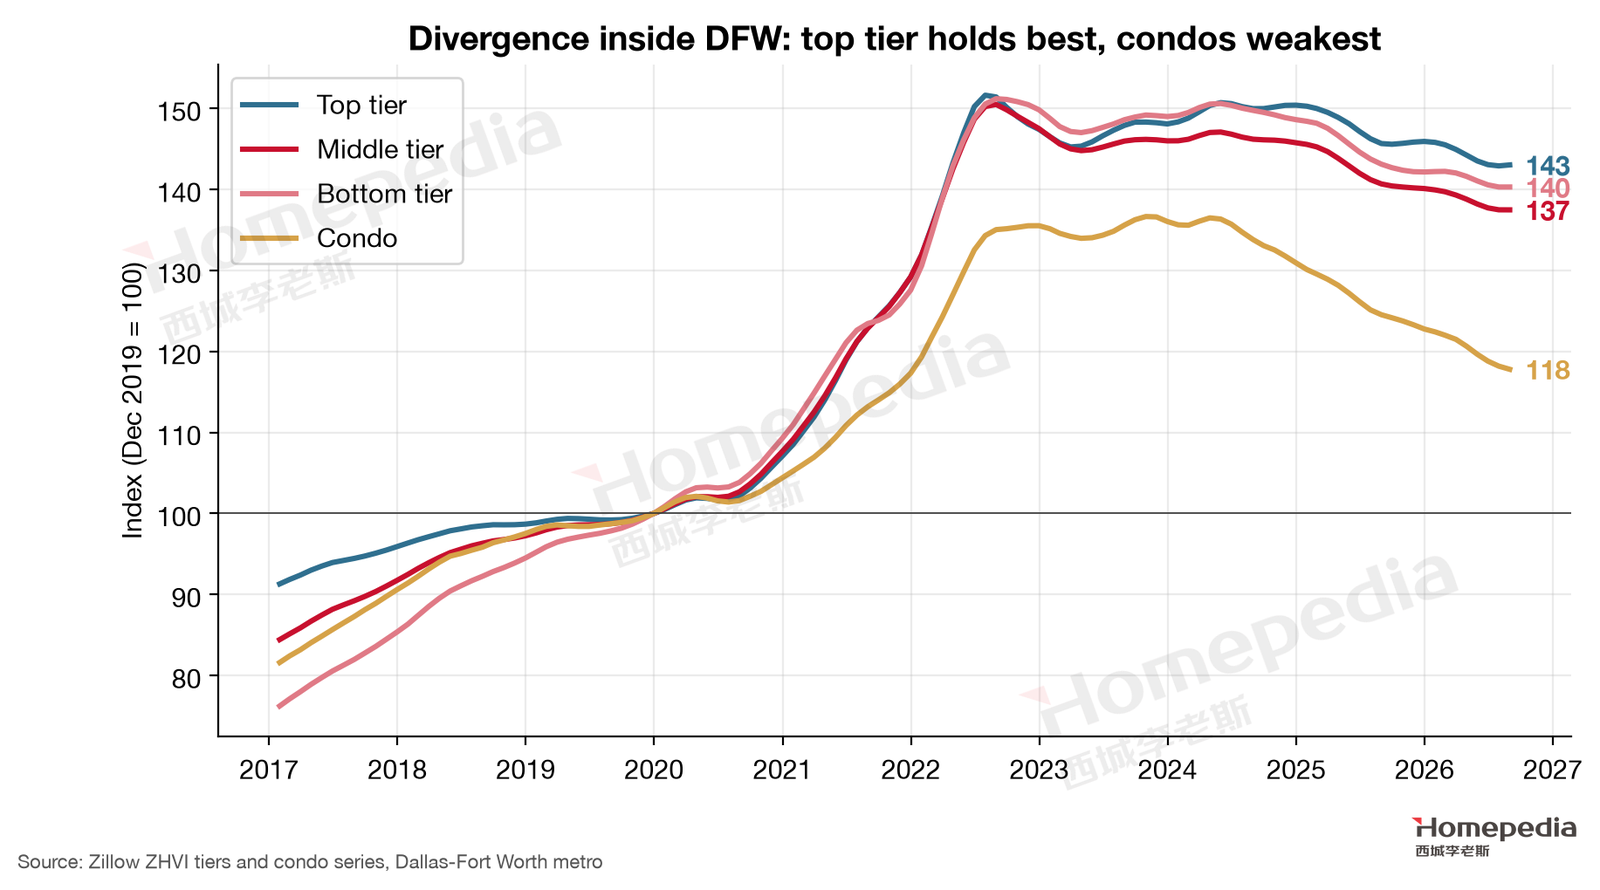
Zillow’s tiered indexes (Figure 19) show DFW’s top tier up 43.0% since late 2019 and just 5.7% below peak; the middle tier up 37.5% and 8.6% below peak; the bottom tier up 40.3% and 7.2% below peak. Condos rose only 17.8%, sit 13.8% below their October 2023 peak, and fell 5.4% over the past year, to a typical value of $213,025 [11]. In a market with abundant single-family supply and cheap land, condos have little scarcity value: a buyer can drive 20 more minutes and buy a new house with a yard.
7.7 Divergence in the Rental Market
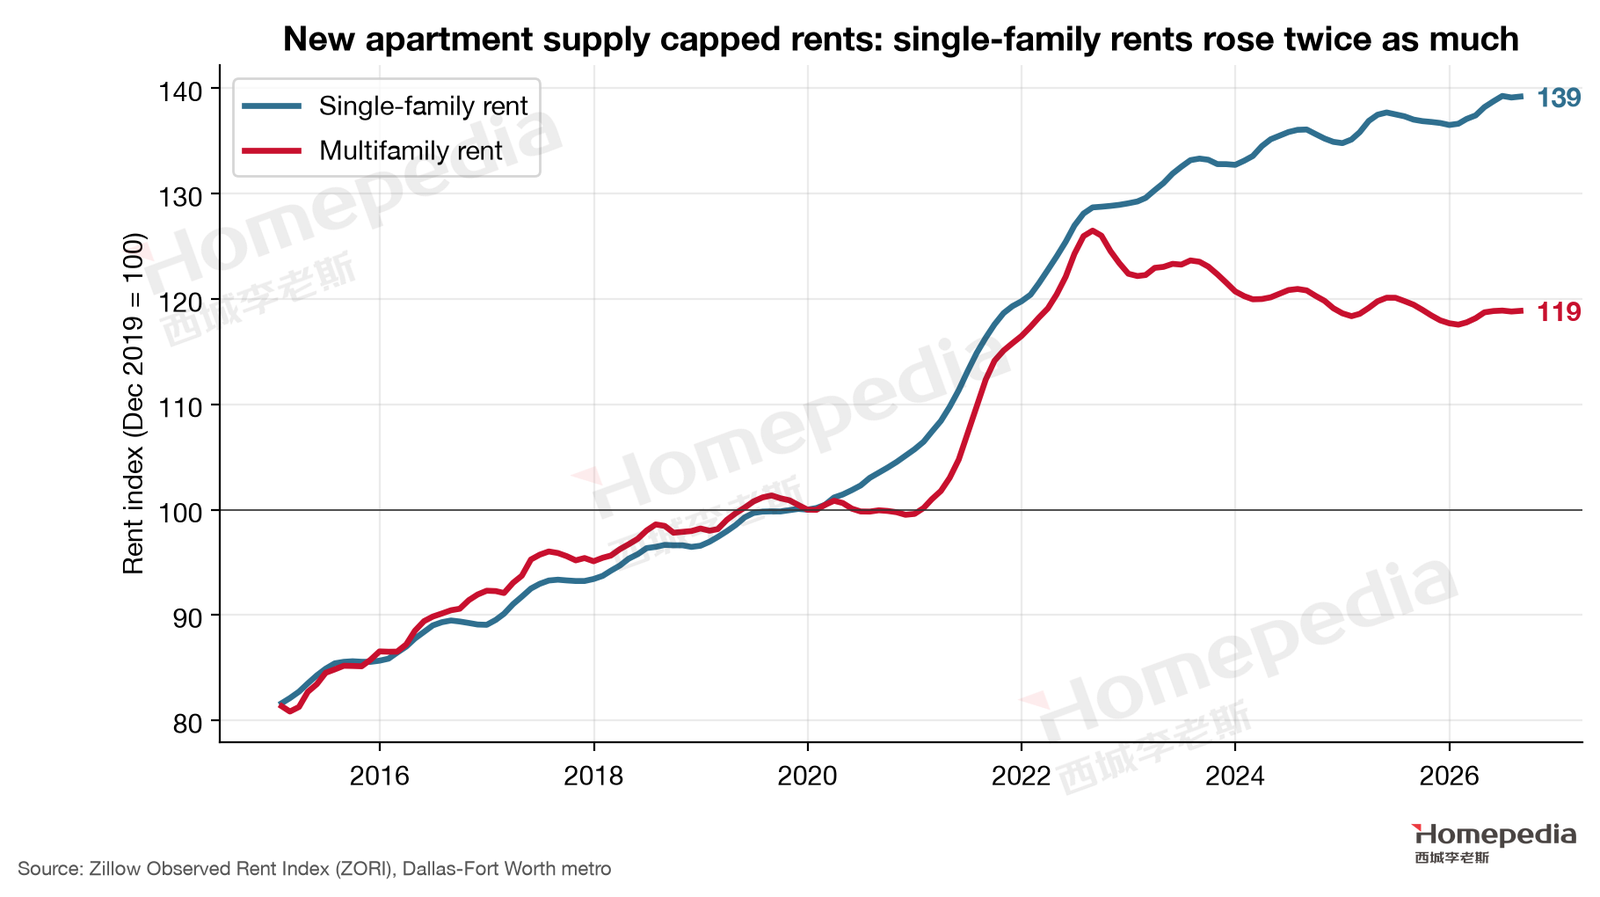
The rental market diverges even more sharply (Figure 20). Zillow’s rent index shows DFW single-family rents up 39.2% since late 2019 (about $2,371 a month), while apartment rents are up only 18.9% (about $1,498) and remain 6.0% below their August 2022 peak [11].
Again the reason is supply. DFW has just been through a historic apartment development cycle. Matthews reports that in the first quarter of 2026, DFW delivered 7,300 new apartment units while net absorption was only 5,100, with 30,200 units still under construction; vacancy was 12.2% and quarterly rent growth was −2.1%, with vacancy expected to peak in 2026 before gradually tightening [29]. New apartments have capped apartment rents, while single-family rentals face limited new supply—and households priced out of ownership (§5) bid up single-family rents.
8. Comparative Analysis: Dallas–Fort Worth, Boston and San Diego
This is the first of SeaHomepedia’s three-city series; the next two reports cover Boston and San Diego. Placed side by side, DFW’s “supply city” profile is unmistakable:
| Indicator | Dallas–Fort Worth | Boston | San Diego | Source |
|---|---|---|---|---|
| Job growth 2019→2024 | +10.3% | −0.5% | +3.2% | BLS QCEW [1] |
| Net domestic migration (2025) | +18,197 | −29,132 | −23,876 | Census [14] |
| Median household income (2024) | $92,733 | $117,825 | $109,132 | ACS [15] |
| Typical home value (Aug 2026) | $360,437 | $733,574 | $930,785 | Zillow [11] |
| Home value ÷ median income | 3.9× | 6.2× | 8.5× | Computed |
| Price change Dec 2019→Aug 2026 | +37.5% | +47.4% | +54.4% | Zillow [11] |
| Distance from recent peak | −8.6% | 0.0% (record) | −2.1% | Zillow [11] |
| Permits per 1,000 residents (2025) | 7.8 | 2.0 | 3.6 | Census BPS [13] |
| Active listings ÷ pre-pandemic | ~1.35× | ~0.80× | ~0.88× | Realtor.com [12] |
| Supply elasticity (Saiz 2010) | 2.18 / 2.80 | 0.86 | 0.67 | Saiz [9] |
| Share of jobs highly exposed to AI | 31.2% | 32.1% | 29.8% | OEWS × Eloundou et al. [3][4] |
The table distills three very different housing markets:
- DFW: strongest demand, even stronger supply. It still gains people and leads in job growth, but builds faster still; inventory exceeds pre-pandemic levels and prices remain below peak. The good news is that it is the only one of the three where homes remain within reach of ordinary incomes: prices are 3.9 times household income.
- Boston: modest demand, very little supply. Jobs are flat and the metro is losing domestic migrants, yet it builds almost nothing new; inventory is 80% of pre-pandemic and prices keep setting records.
- San Diego: scarce but fragile. Prices are 8.5 times income, with the heaviest dependence on high-income buyers; any shock to that group (defense budgets, biotech funding, tech stocks) is amplified.
For investors these call for entirely different strategies. In Boston and San Diego, scarcity itself is the source of returns—owning is winning. In DFW, scarcity exists only in specific pockets inside the metro, so choosing the right neighborhood and product matters far more than choosing the city. We develop this in the next two reports.
9. Scenario Analysis and Leading Indicators
We define each scenario by the conditions under which it holds and the signals that would reveal it. These are conditional scenarios, not point forecasts; the weights in parentheses are our subjective judgment based on current data.
| Upside (~20%) | Base (~55%) | Downside (~25%) | |
|---|---|---|---|
| Overall price direction (12–24 months) | Modest gains of 3–6% | Roughly flat (±2%) | A further 5–8% decline |
| Conditions | 30-year rate below 6%; HQ arrivals and finance expansion continue; single-family starts fall noticeably | Rates of 6.5–7.5%; job growth of 1–2% a year; builders keep incentives, starts drift lower | Rates above 7.5% for an extended period; net white-collar job losses; builders cut prices sharply to clear inventory |
| Luxury single-family | Top school districts lead a return to 2022 highs | Stable to slightly higher | Mild correction, much smaller than overall |
| Primary homes | Recover with the market | Flat; depends on builder incentives | Under pressure; new-construction exurbs lead declines |
| Condos | Stabilize | Remain soft | Fall another 10%+ |
| Single-family rentals | Steady rent growth | Modest rent growth | Flat rents |
| Multifamily | Vacancy falls quickly; rents recover | Vacancy declines slowly | Vacancy stays in double digits |
Base case: sideways with divergence (~55%). This is the most likely path on current data. Rates hover between 6.5% and 7.5% and buyers remain highly price-sensitive; jobs keep growing 1–2% a year and the population keeps adding 100,000+ people annually, so demand does not disappear; builders keep offering buydowns and price concessions to maintain sales, but margin pressure gradually lowers new starts. In this balance, overall DFW prices are roughly flat over the next year or two while internal divergence widens: established neighborhoods and top school districts edge up or hold, while new-construction-heavy exurbs, condos and new-apartment submarkets drift lower. Sales volume stays low because many owners who bought at around 3% in 2020–2022 are reluctant to trade into a 7% mortgage—a “rate lock-in” that limits resale supply and cushions prices against a sharp fall.
Upside: a modest recovery (~20%). The trigger is a meaningful drop in rates. If 30-year rates return below 6% (they briefly touched 5.98% in February 2026), the payment on a typical home falls by about $245 a month by our calculation, bringing many sidelined households back; meanwhile, the slowdown in starts caused by high rates in 2024–2025 would translate into fewer new homes around 2027. Recovering demand plus shrinking supply could produce a 3–6% rise, led by the top tier and established neighborhoods returning to 2022 highs. Even in this scenario DFW is unlikely to repeat the 2020–2022 surge: builders’ land pipelines and capacity remain, and supply will follow prices up again.
Downside: another leg lower (~25%). The trigger is rates holding above 7.5% while jobs weaken. A plausible path: AI automation accelerates the squeeze on back-office roles and hiring in finance and business services stalls; domestic in-migration slows further or turns negative; builders shift from rate buydowns to outright price cuts, and lower new-home prices drag down nearby resale valuations. DFW prices could then fall another 5–8%, more in exurbs and the low end, with condos down 10% or more. Even so, we do not expect a 2008-style crash: owners’ loan quality and equity are far stronger than in 2008, so forced sales would be rare—and Texas largely avoided the subprime crisis precisely because elastic supply kept prices from becoming a bubble [8].
Eight leading indicators readers can track each quarter (upside / downside thresholds in parentheses):
- DFW nonfarm job growth, year over year (BLS CES): >2% upside; <0% downside. August 2026: +1.1%.
- 30-year fixed mortgage rate (Freddie Mac PMMS): <6% upside; >7.5% downside. October 1, 2026: 7.28%.
- Active inventory relative to pre-pandemic (Realtor.com): <1.1× upside; >1.5× downside. Currently about 1.35×.
- Share of listings with a price cut (Realtor.com): <20% upside; >30% downside. September 2026: 27.5%.
- Single-family permits (Census BPS): a 15%+ year-over-year decline signals shrinking supply (upside). 2025: 39,790.
- Apartment vacancy (market reports): below 10% signals a multifamily recovery. Q1 2026: 12.2%.
- Net domestic migration (Census, released each December): back above 50,000 upside; negative downside. 2025: 18,197.
- Builder incentives and gross margins (D.R. Horton and peers, quarterly): narrowing incentives and rising margins signal easing new-home supply pressure.
10. Outlook by Property Type
| Property type | Map view | Report conclusion | Key evidence |
|---|---|---|---|
| Luxury single-family | Split | Steadiest—but only in established neighborhoods and top school districts | Priciest fifth of ZIPs −0.3% in three years; top tier only −5.7% from peak |
| Primary homes | Neutral | Neutral to soft; competes head-on with new homes | Middle tier −8.6% from peak; builders average ~$362k with heavy incentives |
| Condos | Soft | The weakest product | −13.8% from peak; −5.4% over the past year |
| Single-family rentals | Neutral | Neutral to firm | Single-family rents +39.2% in five years; priced-out households sustain demand |
| Student housing | Selective | Purely school-specific | UTA enrollment a record 42,710; UNT down 2,612 in a year |
| Multifamily | Cautious | Cautious; wait for the vacancy turn | Apartment rents −6.0% from peak; 12.2% vacancy; 30,000+ units under construction |
Luxury single-family. This is DFW’s closest thing to a scarce asset, but the scarcity comes from location, not the house. Established school-district neighborhoods such as Highland Park, University Park, Southlake, Colleyville and parts of Plano and Frisco have almost no developable land nearby, so new homes cannot compete directly; their buyers are largely in finance, law, medicine and corporate management, with incomes less exposed to AI. By contrast, new “luxury communities” on the exurban fringe enjoy no such protection—their competitor is the next community to open.
To judge whether a high-priced home is genuinely scarce, ask three questions. First, is there large developable land within two or three kilometers? If so, it will face new-home competition in the coming years. Second, is its school district consistently among the top-rated in Texas? School quality is the main price support at the top of the DFW market, and good district boundaries are essentially fixed. Third, is the commute to a major job center (Uptown, Las Colinas, Legacy West, Frisco’s corporate campuses) under 30 minutes? Homes with three “yes” answers held up best in this correction; a single “no” means evaluating it like an ordinary primary home.
Primary homes ($300,000–$450,000). This is the price band where resale homes compete head-on with builders, who can offer rate buydowns, closing-cost help and free upgrades that resale sellers struggle to match. We expect this segment to be roughly flat over the next year or two, depending on rates and the depth of builder incentives.
Condos. In a metro with abundant single-family supply, condo demand is inherently limited, and rising insurance and HOA costs in Texas further reduce their appeal. Unless the building is in a walkable core such as Uptown and has healthy HOA finances, we do not recommend condos as investments. There is also a structural reason: in most U.S. metros condos are the entry option for buyers who cannot afford a house, but in DFW the same budget (about $213,000, the typical DFW condo) buys a larger older house in the outer suburbs or approaches new townhome pricing, so condos lose their entry-price advantage. For owner-occupants who genuinely want an urban, walkable lifestyle, this is a good time to buy—but review the HOA’s reserve study, recent special assessments and insurance renewals first.
Single-family rentals. Households priced out by high prices and rates are a steady source of single-family rental demand, and single-family rents have risen twice as fast as apartment rents over five years. But investors must account for property taxes and insurance. A simple example:
Example: the real return on a typical single-family rental
Purchase price $360,437 (DFW typical value), rent $2,371 a month (DFW typical single-family rent): annual rent of $28,452 and a gross yield of 7.9%—attractive at first glance. Subtract property tax (at 2.2%) of about $7,930, insurance of about $3,000, and vacancy, repairs and management at 20% of rent (about $5,690). Net operating income is about $11,830, a cap rate of about 3.3%; even with a 1.7% tax rate and $2,500 insurance, it is only about 3.9%.
The 30-year mortgage rate is 7.28%. Financing this purchase means borrowing at a cost above the asset’s return, so leverage magnifies losses rather than gains (“negative leverage”). Today, single-family rental returns in DFW come mainly from all-cash or low-leverage ownership and long-run rent growth, not cash flow.
That does not mean single-family rentals are not worth doing—they are still DFW’s steadiest rental product—but the purchase price must be low enough. Choosing among listings that have sat 60+ days with motivated sellers, or cities with lower tax rates, is how to get net yields back above a reasonable 5%.
Student housing. This is entirely a school-by-school story. UT Arlington enrolled a record 42,710 students in fall 2025, up 2.6%, with its largest freshman class in 130 years [30], while the University of North Texas fell from 46,180 to 43,568 students, a drop of 2,612 [31]. Look at the specific school, the walking distance and the university’s own housing plans—not the metro.
Multifamily. Demand is real—DFW’s population is still growing and the bar to ownership is high—but the supply left by this historic development cycle (30,000+ units still under construction in Q1 2026) needs time to absorb. Deliveries are falling and vacancy should decline slowly; until vacancy is clearly below 10% and rents are growing again, new development returns will be squeezed by both high financing costs and high vacancy. This is a time to study and screen projects, not to buy aggressively. For experienced institutional or larger investors, a window is opening after the delivery peak: some new projects financed with high leverage at low rates face loan maturities and below-plan occupancy and may trade below replacement cost. The prerequisites are controllable capital costs, the ability to absorb a one-to-two-year lease-up, and a clear view of new supply in the specific submarket. For individual investors we suggest starting with single-family rentals rather than multifamily.
11. Strategic Implications for Market Participants
11.1 Buyers
- Negotiate hard. More than a quarter of listings have cut prices and the median listing has sat 62 days. For homes listed over 60 days, offering below list and asking the seller to cover closing costs is normal.
- Compare builder incentives carefully. Rate buydowns are very valuable when market rates exceed 7%. On a home of about $360,000 with a loan of about $288,000, buying the rate down from 7.28% to 3.99% cuts principal and interest from about $1,973 to $1,375—about $598 a month. If you expect to hold seven years, those savings are worth about $39,000 discounted at the market rate, equivalent to roughly an 11% price cut. “$20,000 off” and “a buydown to 3.99%” are very different offers; always convert before comparing. Confirm three things: whether the buydown is permanent or only for the first two years (a 2-1 buydown); whether it has been built into the price; and whether the community still has many unbuilt lots—they will compete with you when you sell.
- For long-term owner-occupancy, favor established neighborhoods and top school districts. They have held up best in the divergence; exurban new homes are cheaper but will face a stream of new-home competition at resale.
- Count the full carrying cost. Property tax, insurance and HOA can add $800–1,000 a month on a $400,000 home. Texas reappraises property every year; owner-occupants can claim the homestead exemption and a cap limiting annual increases in appraised value to 10% (Texas Tax Code §23.23)—file immediately after purchase. If the appraisal notice you receive around May is clearly above market, you can protest it.
- Buy when rates are high, refinance when they fall—but do not bet on it. Rates are at a 52-week high. If you plan to own long term, you can lock in a price while buyers have leverage and refinance later if rates fall—but make sure you can afford the payment at today’s rate. Do not treat “I can always refinance” as a given.
11.2 Sellers
- Price to the latest sales, not the 2022 peak. Most ZIP codes are still 5–10% below peak.
- Your real competitor is the nearby new-home community. Learn what local builders are offering and consider buyer rate buydowns or closing-cost credits instead of a straight price cut.
- Sellers of high-end homes in established neighborhoods need not panic. That segment has been flat for three years; sensible pricing and good condition are enough to sell.
- Low-end and exurban sellers should be decisive. If you must sell within a year, price early and accurately rather than chasing the market down. In a market where over a quarter of listings have cut prices, a home listed too high that sits for three months often sells for less than one priced right from the start, because buyers read “on the market a long time” as “something is wrong.”
- Prepare the home to be compared with new construction. Buyers will compare your home with new homes a few miles away that come with warranties, new appliances and energy-efficient design. A pre-inspection, fixing obvious problems and refreshing the most visible elements (paint, lighting, flooring) can narrow that psychological gap.
11.3 Investors
- Single-family rentals are DFW’s best rental asset, but evaluate them on returns after property tax and insurance and favor established areas with steady demand and little new-home competition. By the example in §10, net yields at typical prices are only 3–4%, below mortgage rates; returns are attractive only when the purchase price is clearly below market or the property is held all-cash.
- Avoid condos and speculative exurban new homes for now, until inventory and prices show clear signs of stabilizing.
- Wait for the multifamily vacancy turn; watch for discounted acquisitions after the delivery peak, but stay cautious on development.
- Data-center stories belong to land and industrial real estate, not housing. Do not buy homes near a site just because a data center was announced.
- Track the eight indicators in §9. When inventory falls below 1.1× pre-pandemic, rates return below 6% and single-family permits shrink meaningfully, DFW will shift from a “divergence market” to a “broad recovery market”—that is the time to add exposure.
12. Foreign Ownership Restrictions: Texas Senate Bill 17
DFW draws strong interest from Chinese-American and Chinese buyers, but since 2025 buying in Texas involves a legal threshold that must be understood first. Texas Senate Bill 17 (SB 17), effective September 1, 2025, restricts governments, certain individuals and companies from “designated countries” (currently China, Russia, North Korea and Iran) from acquiring Texas real property—covering homes, commercial property, farmland, minerals and water rights [35].
Based on the Texas Real Estate Research Center’s analysis of the law, who is and is not affected is roughly as follows [35]:
| Status | Can you buy in Texas? |
|---|---|
| U.S. citizens (including dual citizens) | ✓ Not restricted |
| U.S. lawful permanent residents (green-card holders) | ✓ Not restricted |
| Visa holders lawfully present and residing in the U.S. (e.g., H-1B, F-1, L-1) | △ One personal homestead only; no investment property |
| Individuals domiciled in China | ✗ Generally prohibited |
| Companies controlled by the above restricted persons | ✗ Prohibited |
| Property owned before September 1, 2025 | ✓ Grandfathered |
| Leases of less than one year | ✓ Not restricted |
Penalties are serious: an individual who knowingly purchases in violation may face a state jail felony, and entities face civil penalties of the greater of 50% of the property’s market value or $250,000, enforced by the Texas Attorney General [35].
Around the law’s effective date, several Chinese citizens living in Texas sued to have it declared unconstitutional. In August 2025 a federal district court dismissed the suit for lack of standing, reasoning in part that the plaintiffs, who had lived in Texas for years and intended to stay, were not domiciled in China and so were not restricted by the law; in December 2025 the Fifth Circuit affirmed the dismissal [36]. This clarified a key point: the law turns on domicile, not nationality. Chinese nationals who live lawfully in the U.S. long term and make it their home have more room to buy a primary residence than many feared.
Our guidance:
- Citizens and green-card holders: SB 17 does not affect you; buy as usual.
- Work-visa holders living in Texas long term: you may buy one homestead but not investment property, and should not use companies or nominees to work around the law. Have an attorney or title company confirm which provision applies to you before you buy.
- Readers living in China who want to invest in DFW: under current law this is essentially not possible. Do not attempt nominee purchases through friends or relatives—that may violate both SB 17 and federal law.
- Everyone: the law and its enforcement are still evolving. This section is not legal advice; consult a licensed Texas attorney before any transaction.
13. Limitations and Risks
Serious research should state when its conclusions would fail. We see four main risks:
- Supply could shrink faster than expected. If high rates and construction costs cause builders to cut starts sharply (Texas residential construction already fell about 13% in 2025 [7]) while demand holds, DFW could face a renewed supply gap in 2027–2028 and move into the upside scenario.
- The direction of rates. Our base case assumes rates stay in a 6.5–7.5% range. A rapid drop into the 5% range could release pent-up demand fast enough to overwhelm supply in the short run.
- AI’s impact could be larger or faster than estimated. Our exposure measure captures potential, not actual displacement. If back-office jobs disappear faster than expected, pressure on the low end will exceed the base case.
- Data limitations. Zillow’s index is smoothed and seasonally adjusted, so it lags at turning points; ZIP-level samples are limited; Saiz’s elasticities are based on pre-2000 data and metro boundaries, and DFW’s land and regulatory conditions have changed since.
Even so, we believe the core logic—DFW’s high supply elasticity converts strong demand into new homes rather than higher prices, producing divergence rather than a broad rally—will hold for the foreseeable future, because it rests on basic facts of geography and institutions.
Appendix A: Methodology and Data Sources
Employment and wages. Metro and county employment comes from BLS QCEW annual averages for 2019 and 2024 (all ownerships); industry analysis uses private-sector NAICS supersectors. Some industries are suppressed at the metro level for confidentiality, so we use supersectors. Monthly trends use BLS CES data for the DFW metro; total employment is seasonally adjusted and industry series are 12-month moving averages of non-seasonally-adjusted data.
AI exposure. BLS OEWS May 2025 occupational data for the DFW metro and the nation, matched to the β exposure scores of Eloundou et al. (2024) (GPT-4 ratings, averaged to 6-digit SOC from O*NET occupations). Matches cover 94.3% of DFW employment. “Highly exposed” means β ≥ 0.5. The measure captures task-level automation potential, not the probability that jobs are actually replaced.
Population and migration. Population and its components come from Census Vintage 2025 metro estimates (July 1). Mover income comes from IRS county-to-county migration data (tax years 2019–20 through 2022–23) for returns moving into DFW’s 11 counties; “other states” means origins in U.S. states other than Texas; average AGI = total AGI ÷ number of returns.
Housing supply. Building permits come from Census BPS county annual data (including imputations). DFW comprises 11 counties (Collin, Dallas, Denton, Ellis, Hunt, Kaufman, Rockwall, Johnson, Parker, Tarrant, Wise), Boston seven counties and San Diego San Diego County. Supply elasticities are from Saiz (2010), Table VI.
Elasticity and prices. The 95 metros in Saiz’s table were matched by name to FHFA all-transactions indexes (metros or divisions); 86 matched. We computed cumulative growth from 2000Q1 to 2026Q2 and the correlation with log elasticity (−0.50).
Cross-metro regression. The matched sample was joined to QCEW metro employment (2019 and 2024 annual averages), keeping one division per parent metro, for 75 metros; two observations with five-year job declines of more than 10% (New Orleans and New Haven—declines that reflect statistical breaks from metro boundary redefinitions) were excluded, leaving 73. Model: price growth (FHFA, 2019Q4→2024Q4) = α + β1·job growth + β2·ln(elasticity) + β3·job growth×ln(elasticity), with heteroskedasticity-robust (HC1) standard errors. Results: β1 = 1.92 (p < 0.001), β2 = 0.125 (p < 0.001), β3 = −2.43 (p < 0.001). Without excluding the outliers, β3 = −1.26 (p = 0.02), with the same sign and significance. The regression is a test of association, not causal identification; Saiz’s elasticities rest on largely exogenous terrain and regulatory factors, which partly mitigates reverse-causality concerns.
Robustness. Using AI exposure thresholds of 0.4, 0.5 and 0.6, or human-rated scores, leaves the ranking of the four areas unchanged; price comparisons over December 2019→December 2024 and December 2019→August 2026 lead to the same conclusion. All results are stored in data/robustness.json and data/cross_section.json.
Prices, rents and inventory. Prices use Zillow ZHVI (all homes, middle tier, smoothed and seasonally adjusted, plus top/bottom tiers and condo series); the ZIP analysis covers 254 DFW ZIP codes with complete data. Rents use Zillow ZORI. Inventory, price cuts and days on market come from Realtor.com metro core metrics. The inventory ratio = current active listings ÷ the 2017–2019 average for the same month, smoothed with a three-month moving average.
Reproducibility. All download scripts, cleaning and charting code, raw data and intermediate statistics are archived in the project’s scripts/ and shared_data/ directories; every chart can be regenerated from the raw data.
Data cutoffs. QCEW 2024; CES August 2026; OEWS May 2025; population estimates July 2025; IRS migration 2022–23; FHFA 2026Q2; Zillow August 2026; Realtor.com September 2026; mortgage rate October 1, 2026.
References
[1] U.S. Bureau of Labor Statistics. Quarterly Census of Employment and Wages, annual averages 2019 and 2024. https://www.bls.gov/cew/ [2] U.S. Bureau of Labor Statistics. Current Employment Statistics (State and Metro Area), Dallas–Fort Worth–Arlington, TX, through August 2026. https://www.bls.gov/sae/ [3] U.S. Bureau of Labor Statistics. Occupational Employment and Wage Statistics, May 2025 (metropolitan and national). https://www.bls.gov/oes/ [4] Eloundou, T., Manning, S., Mishkin, P., & Rock, D. (2024). GPTs are GPTs: Labor market impact potential of LLMs. Science, 384(6702), 1306–1308. Data: https://github.com/openai/GPTs-are-GPTs [5] Dodini, S., & Smith, T. (2026, September 1). Job postings show early signs of AI automation impact. Dallas Fed Economics, Federal Reserve Bank of Dallas. https://www.dallasfed.org/research/economics/2026/0901 [6] Dodini, S., & Smith, T. (2026, September 22). AI plays a role in weak labor market for college graduates. Dallas Fed Economics, Federal Reserve Bank of Dallas. https://www.dallasfed.org/research/economics/2026/0922 [7] Leigh, R., & Orrenius, P. (2026, February 20). Texas job growth expected to pick up following flat 2025. Southwest Economy, Federal Reserve Bank of Dallas. https://www.dallasfed.org/research/swe/2026/swe2603-orrenius-texasupdate [8] Di, W., & Jayashankar, A. (2023, April 21). Texas’ cheap housing edge slipping away as resilient demand outpaces supply. Southwest Economy, Federal Reserve Bank of Dallas. https://www.dallasfed.org/research/swe/2023/swe2304 [9] Saiz, A. (2010). The geographic determinants of housing supply. Quarterly Journal of Economics, 125(3), 1253–1296. [10] Federal Housing Finance Agency. House Price Index, All-Transactions, Metropolitan Statistical Areas and Divisions, through 2026Q2. https://www.fhfa.gov/data/hpi [11] Zillow Research. Zillow Home Value Index (ZHVI), Zillow Observed Rent Index (ZORI), new construction and affordability series, through August 2026. https://www.zillow.com/research/data/ [12] Realtor.com Economic Research. Residential Data, Metro Core Metrics, through September 2026. https://www.realtor.com/research/data/ [13] U.S. Census Bureau. Building Permits Survey, county annual files 2015–2025. https://www.census.gov/construction/bps/ [14] U.S. Census Bureau. Metropolitan and Micropolitan Statistical Area Population Totals and Components of Change, Vintage 2025 and Vintage 2020. https://www.census.gov/programs-surveys/popest.html [15] U.S. Census Bureau. American Community Survey 2024 1-Year Estimates, Table B19013 (accessed via Census Reporter). https://censusreporter.org [16] Internal Revenue Service, Statistics of Income. County-to-County Migration Data, 2019–2020 through 2022–2023. https://www.irs.gov/statistics/soi-tax-stats-migration-data [17] Freddie Mac. Primary Mortgage Market Survey, week of October 1, 2026. https://www.freddiemac.com/pmms [18] CBRE. (2026). North America Data Center Trends H2 2025: Dallas–Ft. Worth. https://www.cbre.com/insights/books/north-america-data-center-trends-h2-2025/dallas-ft-worth-data-center-market [19] Utility Dive. (2026, June 22). Texas, facing 438 GW queue, approves initial large-load interconnection process. https://www.utilitydive.com/news/texas-facing-438-gw-queue-approves-initial-large-load-interconnection-pro/823367/ [20] Joint Legislative Audit and Review Commission of Virginia. (2024). Data Centers in Virginia (Report 598). https://jlarc.virginia.gov/pdfs/reports/Rpt598-2.pdf [21] CultureMap Dallas. (2025, June 20). Dallas ranks No. 1 city in U.S. for corporate HQ relocations (citing CBRE). https://dallas.culturemap.com/news/innovation/corporate-headquarters-relocations-dfw/ ; WFAA. (2026). Dallas–Fort Worth leads nation in corporate HQ relocations (citing CBRE). https://www.wfaa.com/article/money/business/dallas-fort-worth-leads-nation-in-corporate-hq-relocations/287-8190e684-c7e1-4794-b987-a87904908e81 [22] WFAA. 5,000 jobs still planned for Goldman Sachs’ new Dallas campus; Construction Dive. Goldman Sachs, developer break ground on Dallas campus. https://www.constructiondive.com/news/goldman-sachs-dallas-office/696773/ [23] Dallas Innovates. Wells Fargo opens $570M campus in Las Colinas for 4,500 employees. https://dallasinnovates.com/wells-fargo-opens-570m-campus-in-las-colinas-for-4500-employees/ [24] JPMorganChase. Our impact in Texas. https://www.jpmorganchase.com/communities/dallas [25] The Dallas Morning News. (2026, January 7). What to know about the Texas Stock Exchange, Y’all Street; Texas Politics (2026, July 7). Texas Stock Exchange opens in Dallas. https://www.dallasnews.com/business/banking/2026/01/07/what-to-know-about-the-texas-stock-exchange-yall-street/ [26] Texas Instruments. Sherman, Texas: 300mm wafer fabs; Dallas Innovates. Texas Instruments starts production at new semiconductor fab in North Texas. https://www.ti.com/about-ti/company/ti-at-a-glance/manufacturing/sherman.html [27] Google Data Centers. Ellis County, Texas; The Dallas Morning News (2025, December 9). Google spending nearly $1B on growing data center campus in southern D-FW. https://datacenters.google/locations/ellis-county-texas/ [28] D.R. Horton, Inc. (2026, July 21). D.R. Horton, Inc., America’s Builder, reports fiscal 2026 third quarter earnings (average closing price $362,000; 23,983 homes closed). https://investor.drhorton.com/~/media/Files/D/D-R-Horton-IR/press-release/dhi-q3-2026-earnings-release.pdf [29] Matthews Real Estate Investment Services. (2026). Dallas–Fort Worth Multifamily Market Report Q1 2026. https://www.matthews.com/insights/dallas-fort-worth-multifamily-q1-2026 [30] The University of Texas at Arlington. (2025, September 15). UTA sets record freshman class for Fall 2025. https://www.uta.edu/news/news-releases/2025/09/15/uta-sets-record-freshman-class-for-fall-2025 [31] The Texas A&M University System, Data Science. (2025, December 1). Enrollment growth trend continues across Texas public higher education institutions in Fall 2025. https://www.tamus.edu/data-science/2025/12/01/enrollment-growth-trend-continues-across-texas-public-higher-education-institutions-in-fall-2025/ [32] Texas Real Estate Research Center, Texas A&M University. (2026). Texas Housing Insight, August 2026 (June 2026 data). https://trerc.tamu.edu/reports/texas-housing-insight-august-2026/ [33] Brookings Institution. (2025). Mapping the AI economy (Dallas–Fort Worth classified as an “AI Star Hub”); reported by Dallas Innovates. https://dallasinnovates.com/dallas-fort-worth-metro-named-ai-star-hub-in-new-brookings-report-mapping-americas-ai-economy/ [34] Ballard Property Tax Protest. (2025). Texas property tax rates by county: 2025 comparison (compilation of county, city and school district rates). https://www.ballardpropertytaxprotest.com/post/texas-property-tax-rates-by-county [35] Texas Real Estate Research Center, Texas A&M University. (2025, September 22). New bill limits foreign real estate ownership in Texas. https://trerc.tamu.edu/article/new-bill-limits-foreign-real-estate-ownership-in-texas [36] National Agricultural Law Center. Federal court dismisses challenge to Texas’ newly enacted foreign ownership law; Jackson Walker LLP. (2025, December 12). 5th Circuit upholds dismissal of lawsuit challenging S.B. 17. https://www.jw.com/news/texas-senatebill17-dismissal/
Disclaimer: This report is for research and educational purposes only and does not constitute investment, legal or tax advice. Real estate investing involves risk; readers should consider their own circumstances and consult licensed professionals.
Leave your email to download the 40-page report
The PDF keeps the full layout for saving and offline reading.
© 2026 Wei Li · Homepedia. All rights reserved. The text, data and charts in this report are protected by copyright and may not be copied, republished, excerpted or used commercially without written permission.
Want to know what this means for your own buying, selling or investing decision? Book a consultation