

Dallas-Fort Worth (DFW) has been one of the fastest-growing major metros in the United States over the past five years, and it is a city I explicitly placed on my list of "AI-era beneficiary cities" in my two previous analyses. Yet from late 2019 through August 2026, Dallas home prices rose only 37.5%, trailing the national gain of 47.9%, and they still sit 8.6% below their 2022 peak (Zillow Research, Metro ZHVI, through August 2026). Those numbers frame the central question of this article: why does a city with near-textbook economic fundamentals fail to keep pace with the national average on home prices?
My answer is that Dallas's problem lies not in demand but in supply. What determines a city's home prices is never "how many people move in," but the relationship between two things: how much the arriving buyers are willing and able to pay, and how easily builders can bring new homes to market. Dallas sits at one extreme. Demand is real, but land is flat and cheap, permitting is fast, and builders are strong, so any wave of demand growth is absorbed by new supply within a year or two. More importantly, the AI shock to white-collar employment lands precisely on the low-to-mid price tier where Dallas supply is most abundant, which will deepen the divergence between "the city wins" and "every house wins."
 Equal inflow, but the narrow vessel fills fast while the wide tray barely rises — capacity sets the price.
The article proceeds in eight sections. First, I confirm just how strong Dallas's fundamentals are. Second, I use migration and income data to identify who the marginal buyer actually is. Third, I introduce housing supply elasticity as the core variable. Fourth, I explain why a single Dallas contains two housing markets. Fifth, I bring AI back into the picture and show how it amplifies that divergence. Sixth, I lay out scenario probabilities for the next one to two years. Seventh, I address the most likely objections. Finally, I distill the method into a checklist readers can apply to any city. This is the first installment of my ten-city series, and the method will recur throughout.
Fundamentals: A Headquarters City, a Finance City, and a Data Center City
Let me be clear about the premise: I am not bearish on Dallas home prices because I am bearish on Dallas. Quite the opposite—the demand side of Dallas is nearly beyond reproach. Bureau of Labor Statistics (BLS) QCEW data show that DFW's average annual employment grew 10.3% from 2019 to 2024, against just 4.6% nationally—more than double the U.S. pace. This is not a cyclical bounce in a single industry; it is a five-year structural expansion.
The expansion is driven by corporate headquarters relocations. According to CBRE's The Shifting Landscape of Headquarters Relocations: 2026 Update, more than 100 companies have moved their headquarters to DFW since 2018, the most of any U.S. metro (CultureMap Dallas's tally for 2018–2024 is likewise roughly 100). And the jobs arriving are high-paying: Goldman Sachs's new Dallas campus can hold more than 5,000 people and is slated to open in 2028 (NPR/Texas Public Radio, August 2026); Wells Fargo's $570 million Las Colinas campus houses 4,500 employees (Dallas Innovates); JPMorganChase has 13,000 employees at its Plano campus and more than 17,000 across DFW (JPMorganChase press release, 2026). The Texas Stock Exchange (TXSE) began trading in Dallas on July 6, 2026 (Office of the Texas Governor).
 Over a hundred headquarters have moved in with high-paying jobs — Dallas's demand side is genuinely strong.
| Employer / Institution | Location | Scale | Source and Year |
|---|---|---|---|
| Goldman Sachs | New Dallas campus | 5,000+ capacity, opening 2028 | NPR / Texas Public Radio, 2026 |
| Wells Fargo | Las Colinas | 4,500 employees, $570M campus | Dallas Innovates |
| JPMorganChase | Plano / DFW | 13,000 in Plano, 17,000+ in DFW | JPMorganChase press release, 2026 |
| Texas Stock Exchange | Dallas | Trading began July 6, 2026 | Office of the Texas Governor, 2026 |
| HQ relocations | DFW | 100+ since 2018, #1 nationally | CBRE, 2026 |
By industry, BLS QCEW shows DFW's fastest-growing sector from 2019 to 2024 was professional and business services, +16.7%, with average annual pay just over $100,000, followed by finance, +11.0%, with average pay around $120,000. Both sectors pay well above the local median household income—the classic profile of a "headquarters city, finance city, and corporate services hub." Infrastructure investment is keeping pace. CBRE's North America Data Center Trends shows DFW data center inventory at roughly 1 GW with 2.4% vacancy in H2 2025, rising to over 1,400 MW with 2.8% vacancy by H1 2026 (Dallas Innovates, citing CBRE H1 2026). Large-load interconnection requests to the Texas grid operator ERCOT climbed from 438 GW to 474 GW, roughly 90% of them from data centers (Utility Dive, 2026).
Measured by employment, corporate relocations, financial-sector expansion, and infrastructure investment, Dallas's demand is real—the problem is not on this side of the ledger.
 All four pillars are solid — jobs, headquarters, finance, infrastructure — weak prices are not the fundamentals' fault.
This means any explanation attributing Dallas's price weakness to "a weak economy" collapses on contact with the data. We must look to the other two ends of price formation: the purchasing-power structure of buyers, and the speed of the supply response. This is a point I stressed repeatedly in 24 U.S. Cities That Benefit from the AI Era: capital expenditure is not housing demand—wages are; and even genuine wage growth does not automatically translate into home prices.
The Marginal Buyer: People Came, But With Less Money Than Imagined
The first concept for understanding home prices is the marginal buyer. A city's prices are not set by the "average household" but by the last small slice of people who both want to buy and can afford to—and by what they are willing to pay. Applied to Dallas, many people picture a wave of Californians selling multi-million-dollar homes and arriving in Texas with cash to bid up houses. The actual data are far more restrained.
Internal Revenue Service (IRS) SOI county-to-county migration data (2020–2023, aggregated across DFW's 11 counties) show that in 2022–2023, roughly 67,000 households moved to DFW from other states, with an average income of $97,000—below the $114,000 average of existing Dallas households. In other words, newcomers were on average poorer than locals, not richer. Only households from California arrived with higher incomes, and even their purchasing power is falling fast: the average income of California households moving to Dallas was about $140,000 in 2021 and had dropped to $112,000 by 2023, while the number of such households fell from 16,000 to 13,000.
 Arriving families earn less on average than locals, and the California cash buyer's wallet is shrinking.
| Metric | Value | Source and Year |
|---|---|---|
| Out-of-state households moving to DFW (2022–2023) | ~67,000; avg. income $97,000 | IRS SOI, 2020–2023 |
| Existing DFW household average income | $114,000 | IRS SOI, 2020–2023 |
| Avg. income of California in-movers | ~$140,000 (2021) → $112,000 (2023) | IRS SOI, 2020–2023 |
| Number of California in-mover households | 16,000 → 13,000 | IRS SOI, 2020–2023 |
| DFW domestic net in-migration | 90,000 (2022) → 18,000 (2025), down 80% | U.S. Census Bureau, Vintage 2025 |
| Texas net migration, 2025 | Domestic 67,000; international 167,000 | Dallas Fed, Southwest Economy, Issue 3, 2026 |
More critically, the flow itself is cooling rapidly. U.S. Census Bureau Vintage 2025 estimates show DFW's domestic net in-migration fell from 90,000 in 2022 to 18,000 in 2025—an 80% decline. The Dallas Fed's Southwest Economy (Issue 3, 2026) confirms the same trend statewide: Texas's domestic net in-migration in 2025 was just 67,000, while international net in-migration was 167,000. International migrants have replaced domestic movers as the main engine of Texas population growth. Their homebuying capacity and timing bear no resemblance to the "sell the California house, arrive with cash" household; they are far more likely to rent first or buy low-to-mid-priced new construction.
The pandemic-era peak of "Californians arriving in Texas with cash" has passed; today's marginal buyer in Dallas is a young household earning less than the local average, pricing $250,000–$400,000 homes rather than $600,000-plus homes.
 The migration flood has thinned to a trickle; today's marginal buyer prices the 250–400k home.
This conclusion will recur throughout the article: since the marginal buyer is concentrated in the low-to-mid price tier, any force suppressing that tier—whether builder supply or AI's impact on white-collar jobs—acts directly on the "pricing layer" of the Dallas market. This is the single biggest difference between Dallas and cities like Seattle or San Diego.
Supply Elasticity: The Variable That Actually Prices Dallas
Now I introduce the most underrated yet most explanatory concept in real estate investing: housing supply elasticity. It measures how much new supply increases for every 1% rise in prices. Consider a thought experiment: two cities each receive 10,000 new households at the same time. The first is bounded by mountains on three sides and ocean on the fourth, its buildable land is essentially exhausted, and a new project takes two or three years to permit—those 10,000 households can only compete for existing homes, and prices climb until some are priced out. The second is surrounded by flat, cheap land, local government welcomes development, and builders can turn farmland into hundreds of homes in six months—prices barely tick up before builders break ground, and new supply pushes the gains back down. The first city is San Diego. The second is Dallas.
This difference has a rigorous academic measurement. Wharton professor Albert Saiz, in The Geographic Determinants of Housing Supply (Quarterly Journal of Economics, 2010, Table VI), estimated supply elasticity for 95 U.S. metros: San Diego 0.67, Boston 0.86, Seattle 0.88, Dallas 2.18—three to four times San Diego's figure. This structural gap shows up directly in building permit data: U.S. Census Bureau Building Permits Survey county-level data show DFW permitted 423,000 housing units from 2020 to 2025, versus just 77,000 in Boston and 64,000 in San Diego. Dallas's population is roughly 1.7 times Boston's, yet it permitted 5.5 times as many units. Even in 2025, when the 30-year mortgage rate averaged 6.60% and ranged between 6.15% and 7.04% (Freddie Mac PMMS), Dallas still approved 66,000 units.
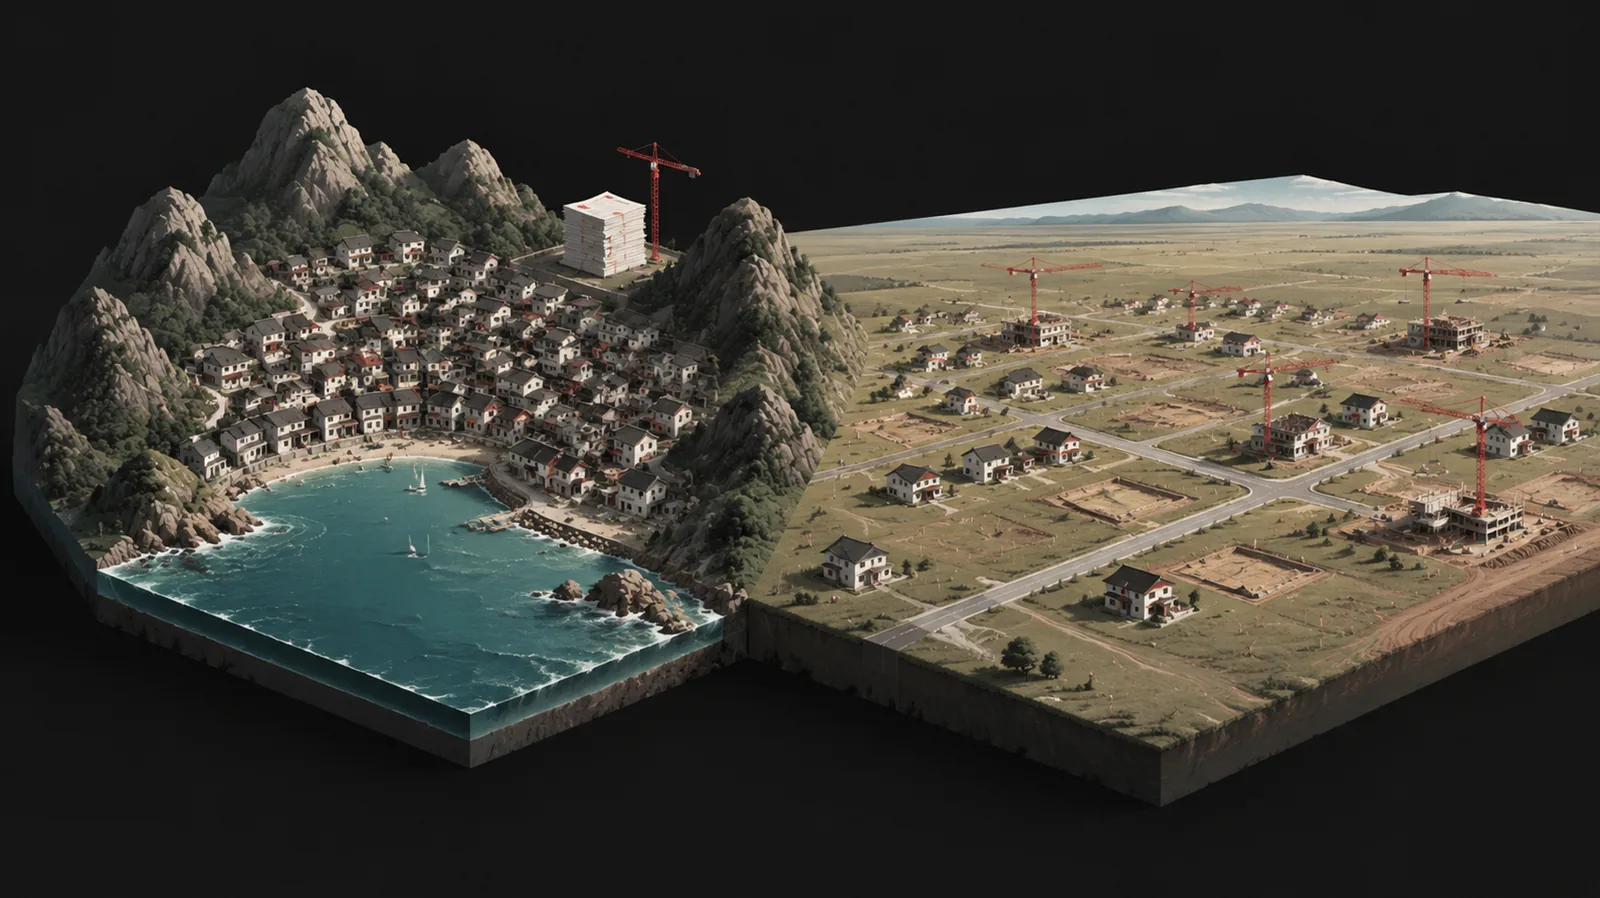 A city boxed in by mountains and sea versus one on open plains — supply elasticity differs threefold.
| Metro | Saiz Supply Elasticity (2010) | Permits 2020–2025 (Census BPS) | Price Response per 1% Job Growth (73-metro regression) | Price Gain, Late 2019–Aug 2026 (Zillow ZHVI) |
|---|---|---|---|---|
| San Diego | 0.67 | 64,000 | ~+2.9% | 54.4% |
| Boston | 0.86 | 77,000 | ~+2.3% | 47.4% |
| Seattle | 0.88 | — | — | — |
| Dallas | 2.18 | 423,000 | ~0 | 37.5% |
To quantify how supply elasticity transmits into prices, my October 2026 Dallas research report pooled 73 U.S. metros in a regression (data: FHFA HPI, BLS QCEW, Saiz 2010). The result is strikingly intuitive: in hard-to-build cities like San Diego, each 1% of job growth adds roughly 2.9% to home prices; in Boston, about 2.3%; in Dallas, approximately zero. Put differently, had Dallas's supply elasticity matched San Diego's, the exact same job growth over the past five years should theoretically have pushed Dallas prices 18 percentage points higher. Those 18 points did not vanish—Dallas builders "ate" them in the form of new homes.
In Dallas, job growth barely translates into price growth, because the moment demand arrives, builders build—supply elasticity, not demand intensity, is the variable that prices Dallas.
 Every surge of demand pressure is vented by builders at once — jobs barely move prices in Dallas.
The implication for investors: in high-elasticity cities, the traditional logic of "buy where jobs are growing fastest" fails and may even invert. The fastest-growing employment areas are usually also the areas with the most developable land and densest new construction, where prices are suppressed the hardest. Collin County, in the next section, is the clearest case of this counterintuitive result.
One Dallas, Two Markets
At this point a natural follow-up arises: does that mean no house in Dallas is worth buying? Of course not. A flat metro average does not mean every home is flat; the money is still there—it has simply changed direction. Supply elasticity is a metro-level average, but "developability" varies enormously across locations within a metro, and that is the root reason Dallas contains two housing markets.
I sorted DFW's 254 ZIP codes into five price quintiles and compared Zillow ZIP-level ZHVI from August 2023 to August 2026. The cheapest 20% of ZIP codes, with a median price of $236,000, fell 6.9% over three years; the most expensive 20%, with a median of $608,000, fell just 0.3%—essentially unchanged. The cheap tier fell more, which contradicts the intuition that high-priced homes are more fragile, but the mechanism is clear: $230,000 to $400,000 is precisely the price band where large production builders excel. D.R. Horton's FY2026 Q3 earnings release reports 23,983 closings and $8.6819 billion in homebuilding revenue—an average closing price of about $362,000. If you own a $300,000-plus resale home, your competitor is not the neighbor down the street; it is a publicly traded company that can offer rate incentives, pay closing costs, and throw in upgrades. One detail worth noting: the 3.99% rate Lennar advertises in DFW is listed on its own website as an FHA 5/1 adjustable-rate mortgage with a 7.156% APR—the true cost of such promotions is higher than the headline, but the competitive pressure on resale sellers is very real.
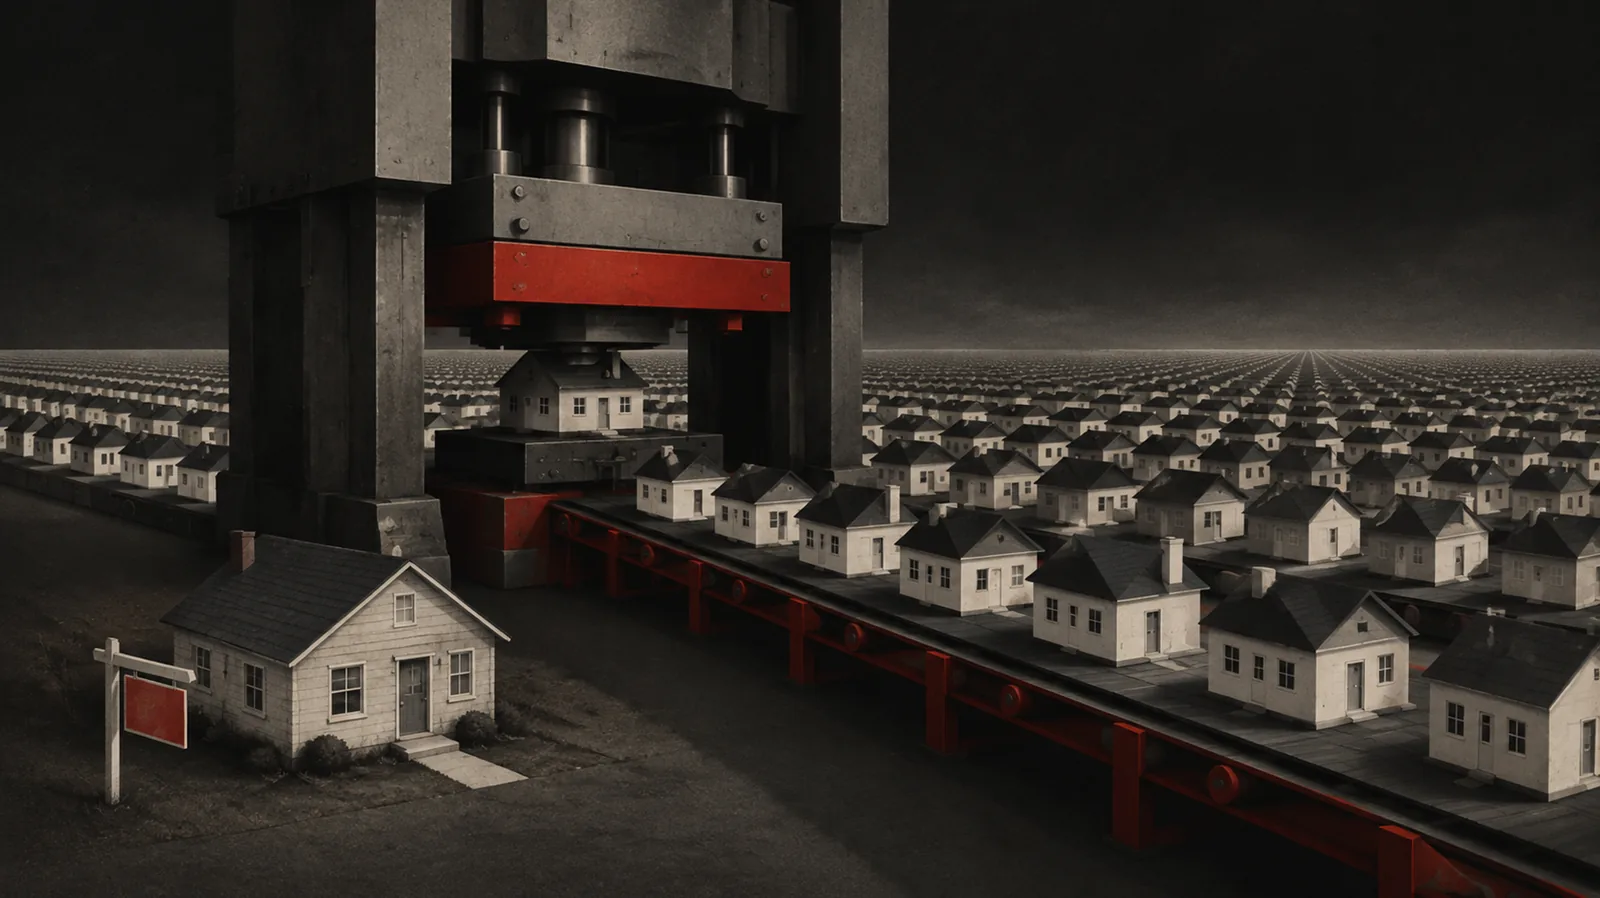 The 230–400k band is exactly what builders mass-produce; existing homes must cut prices to compete.
| Segment | Median Price | Change, Aug 2023 → Aug 2026 | Competitive Landscape |
|---|---|---|---|
| Cheapest 20% of ZIPs | $236,000 | −6.9% | Competes head-on with D.R. Horton and other builders' new homes |
| Most expensive 20% of ZIPs | $608,000 | −0.3% | Mature areas where builders cannot get in |
| Collin County (countywide) | — | −11.0% from peak; jobs +26.8% over same period | Fastest job growth, densest new construction |
The high end follows an entirely different logic. Highland Park, University Park, Southlake, Colleyville, and the established, highly rated school zones of Plano and Frisco are largely built out; builders cannot get in even if they want to, and local supply elasticity in these pockets approaches that of Seattle or Boston. The most counterintuitive case is Collin County: one of the fastest-growing counties in the Dallas metro, with employment up 26.8% from 2019 to 2024 (BLS QCEW county data). By conventional logic prices should have surged. Instead, county prices sit 11.0% below peak (Zillow County ZHVI, August 2026), among the steepest declines in the metro. The reason: the northern suburbs are also where new subdivisions are most concentrated—the hottest demand landed exactly where supply is easiest to add.
It is not that Dallas lacks demand; wherever supply can easily expand, prices get suppressed. What is truly scarce is the location where builders can never get in.
 Mature neighborhoods that builders can never enter are the only truly scarce asset in Dallas.
This is the same question I examined in The Biggest Lie in American Homebuying: Does a Prime Location Really Hold Value?: the value retention of a so-called "good location" is fundamentally the result of low local supply elasticity, not some magic of the address itself. In Dallas, this logic is pushed to the extreme—the metro as a whole commands almost no premium, yet mature neighborhoods have held their prices.
How AI Amplifies the Divergence
Now let us bring AI back in. Anthropic's September 2026 paper Economic Scenarios for Transformative AI (2024 Nobel laureate in economics Daron Acemoglu read the draft and provided comments) sets out several core judgments: AI hits a large swath of white-collar jobs first while blue-collar wages rise; AI may not create enough new jobs to absorb displaced white-collar workers, so some unemployment may be long-term; total productivity surges but new wealth concentrates among a few—in the paper's extreme scenario, white-collar wages are 11.5% below baseline while other occupations are 34% above, and labor's share of income falls from 60% to 45%; and, most relevant to real estate, cognition, analysis, and judgment become ever cheaper while land, energy, the grid, construction labor, healthcare, caregiving, minerals, and data centers—the truly scarce resources—become ever more expensive. These are precisely the arguments I have made over the past two years in videos such as AI Is Killing White-Collar Jobs, But Blue-Collar Workers Will Get Richer.
Applying this framework to Dallas, the key is occupational structure. Overlaying BLS OEWS (May 2025) with the GPT exposure measures of Eloundou et al. (2024, Science), 31.2% of DFW jobs—about 1.19 million—are highly exposed to AI, above the national 28.6%. The two largest categories are office/administrative support and business/financial operations, together about 760,000 workers: customer service reps, clerks, junior analysts. And these workers are exactly the marginal buyers identified in the second section—the core purchasers of $250,000–$400,000 homes. The shock has moved from forecast to data: a Dallas Fed study dated September 1, 2026, finds that since ChatGPT's arrival, postings for AI-high-exposure jobs in Texas have fallen about 8% relative to low-exposure jobs; a second study dated September 22 shows the employment rate of new graduates in AI-high-exposure majors down 1.7 percentage points.
 High-exposure AI jobs are clerks, service reps, junior analysts — the very buyers of mid- and low-priced homes.
| Metric | DFW | U.S. | Source and Year |
|---|---|---|---|
| Share of jobs highly exposed to AI | 31.2% (~1.19 million) | 28.6% | BLS OEWS May 2025 × Eloundou et al. (2024, Science) |
| Office/admin + business/financial jobs | ~760,000 | — | Same |
| Relative change in high-exposure postings | ~−8% | — | Dallas Fed, 2026-09-01 |
| Employment rate, high-exposure majors | −1.7 pp | — | Dallas Fed, 2026-09-22 |
The transmission path is therefore sharp: AI compresses the marginal purchasing power of middle-class white-collar workers, and Dallas's most abundant supply is precisely the low-to-mid-priced housing those workers buy. Managers, physicians, attorneys, and senior finance professionals are affected relatively less, and the mature neighborhoods they buy into are the ones builders cannot enter. The two forces stack in the same direction, so the conclusion is not that Dallas "goes up" or "goes down," but that the gap between scarce high-end homes and replicable ordinary homes is likely to keep widening. In AI Is Redistributing High-Income Jobs: Nine U.S. Cities Face Downward Price Pressure I discussed AI's distributional effect across cities; Dallas demonstrates AI's distributional effect within a city.
AI's real impact on Dallas home prices is not on the aggregate but on the structure: it weakens exactly the buyers of the housing tier where Dallas supply is most abundant.
 AI does not shift the total; it widens the gap between scarce homes and replicable ones.
A brief comparison with Seattle here, drawn from my own experience as a modular developer. Seattle's supply elasticity is just 0.88—mountains to the east, water to the west, and layer upon layer of permitting in between. Homes are inherently hard to build there, so whoever can build faster and cheaper holds a pricing advantage—which is why our modular projects, with construction costs roughly 30% below conventional methods, still matter (see Triple Your Money in a Year: Modular Construction, the New Investment Lane). Transplant the same approach to Dallas and the advantage shrinks dramatically: building there is not hard and costs are already low, so a cost edge does not create scarcity. Supply elasticity determines not only home prices but also which development models have value in which cities.
Scenario Judgments for the Next One to Two Years
Building on the five sections above, I offer three scenarios for Dallas home prices over the next one to two years. First, the rate backdrop: Freddie Mac PMMS reported the 30-year fixed mortgage rate at 7.40% on October 8, 2026, above the 2025 full-year average of 6.60% and the year-end 6.15%. At this rate level, the gap between purchase-cost pressure in Dallas's low-to-mid tier and builders' ability to offer rate buydowns is the most direct drag on the resale market.
| Scenario | Trigger | Price Change | Probability |
|---|---|---|---|
| Base: flat with divergence | Rates hold in current range; employment structure persists | Metro within ±2%; good school zones, mature neighborhoods, and supply-constrained single-family homes edge up; far-suburban new builds remain under pressure | 55% |
| Upside: rates fall | 30-year mortgage rate drops below 6% | +3% to +6% | 20% |
| Downside: rates and jobs both deteriorate | Mortgage rate exceeds 7.5% again while white-collar employment keeps shrinking | −5% to −8% | 25% |
The most probable scenario (55%) is a flat metro market within ±2%, with continued internal divergence: good school zones, mature neighborhoods, and supply-constrained single-family homes edge up while far-suburban new builds stay under pressure. The second scenario (20%) is the 30-year rate falling below 6%, in which case Dallas could rise 3% to 6%—note that even in this upside case, the gain is far smaller than the potential rebound in low-elasticity cities at the same rate, because lower rates also accelerate builder starts. The third scenario (25%) is rates climbing back above 7.5% while white-collar employment keeps contracting, in which case Dallas could fall another 5% to 8%, with declines concentrated in the construction-dense northern suburbs.
 Of three scenarios, flat-and-diverging is most likely; even if rates fall, builders will restart just as fast.
I assign 55% probability to flat-with-divergence, but under no scenario do I expect a 2008-style crash—the New York Fed's Q2 2026 Household Debt and Credit Report shows median credit scores at mortgage origination far above 2007 levels, and today's homeowner loan quality is simply not comparable to that cycle.
All of the scenario judgments in this section, the underlying data, and my corresponding calls on Boston and San Diego are available in the site's newly launched Housing Price Map; the full Dallas city research report is also freely available there, where readers can view the three-scenario outlook by property type—high-end single-family, mainstream owner-occupied, condo, rental, and more.
Counterarguments and Responses
Objection one: Dallas is only temporarily lagging; once rates fall and in-migration recovers, prices will catch up. This is the most common view, and it implicitly assumes Dallas's weakness is cyclical. But the core evidence in this article points to structural causes: the Saiz (2010) elasticity of 2.18 is a long-run parameter set by geography and institutions, not by the rate cycle; in 2025, with mortgage rates averaging 6.60% and peaking at 7.04%, DFW still permitted 66,000 units (Census BPS), showing that the builder supply response did not stall under high rates. The 73-metro regression shows Dallas's marginal price response to job growth is near zero—not a one-year anomaly but the five-year average for 2019–2024. Falling rates would indeed revive demand, which is exactly why I give the upside scenario 20%, but the same rate decline would accelerate builder starts, which is why I cap the upside at 6%. A "catch-up" requires supply that cannot keep up, and Dallas has never been short of supply.
Objection two: high-paid workers from financial headquarters and data centers will hold prices up. This objection is half right. Goldman's 5,000-plus, JPMorganChase's 17,000-plus in DFW, finance-sector pay around $120,000—these high-income groups genuinely underpin the resilience of the top 20% of ZIP codes, down just 0.3% over three years. But it cannot explain aggregate prices, for two reasons. First, data centers are capital-intensive, not labor-intensive; 474 GW of interconnection requests represent demand for electricity and land, not proportional demand for homes—a point I examined specifically in the 24-city analysis. Second, marginal pricing happens in the low-to-mid tier, and IRS SOI data show out-of-state arrivals in 2022–2023 averaged $97,000 in income, below the local $114,000, while California in-movers' income fell from $140,000 to $112,000. High-paying headquarters jobs change demand for Dallas's most expensive tier of housing; they have not made the buyer base for low-to-mid-priced homes any richer.
 Data centers are capital-intensive, not labor-intensive; megawatts do not translate into proportional homebuying.
Objection three: cheaper homes fell more simply because they are more rate-sensitive, not because of builders. Rate sensitivity is certainly one factor—first-time buyers face the tightest payment constraints. But if rates were the only cause, Collin County, with 26.8% job growth, should not be 11.0% below peak and among the hardest-hit counties. Under the same rate environment, the county with the strongest job growth fell the most—only concentrated supply explains that. I should also be candid about a measurement issue: different price indices yield different estimates of "decline from peak." This article uses Zillow ZHVI throughout for internal consistency; when readers encounter different decline figures from other sources, they should first check the index methodology and comparison dates rather than placing them side by side with this article's 8.6%. Directionally, every measure points to the same conclusion: Dallas trailed the nation and has not regained its peak.
Method Summary: Six Questions for Judging Any City's Home Prices
What I most want readers to take from this piece is not any single number but a method that can be applied to any city. A strong city economy does not mean the city's homes must appreciate; the city winning does not mean every house wins. Reversing the argument order of this article yields an actionable checklist.
- Is demand real? Check BLS QCEW job growth and industry mix, corporate relocations, and average pay. Dallas: jobs +10.3% in 2019–2024, professional and business services +16.7%, finance +11.0%—demand is real.
- Who is the marginal buyer, and what do they earn? Compare IRS SOI in-mover income to local income, and track Census domestic net migration trends. Dallas: in-movers at $97,000 versus locals at $114,000; domestic net in-migration down 80% in three years.
- How elastic is supply? Check the Saiz (2010) elasticity coefficient and Census BPS permit volume relative to population. Dallas: elasticity 2.18; 423,000 permits in five years, 5.5 times Boston.
- Does job growth convert into prices? Use the job-to-price regression coefficient. Dallas is roughly zero, San Diego roughly 2.9—this determines whether "buy where jobs grow fastest" holds.
- Where within the city is supply constrained? Sort ZIP codes by price tier and compare performance to find the locations builders cannot enter. Dallas: top 20% down 0.3%, bottom 20% down 6.9%, Collin County with the fastest job growth yet down 11%.
- Which price tier's buyers bear the AI exposure? Overlay BLS OEWS with Eloundou (2024) exposure measures to see the count of high-exposure jobs and the price band they buy in. Dallas: 31.2% highly exposed; 760,000 office/admin and business/financial workers mapped to $250,000–$400,000 homes.
In a city with abundant land, fast permitting, strong builders, and extremely elastic supply, what is scarce is not housing but the location where builders can never get in; when judging a city, ask about supply elasticity first, the marginal buyer second, and GDP last.
 Judge a city from the ground down: supply elasticity first, marginal buyer second, surface GDP last.
Over the next two months I will apply these same six questions to ten major U.S. cities, one at a time. Dallas is the first, and the most extreme case of supply elasticity—and precisely because it is extreme, it shows most clearly why employment, population, AI, and supply must be read on the same spreadsheet rather than told as separate stories.